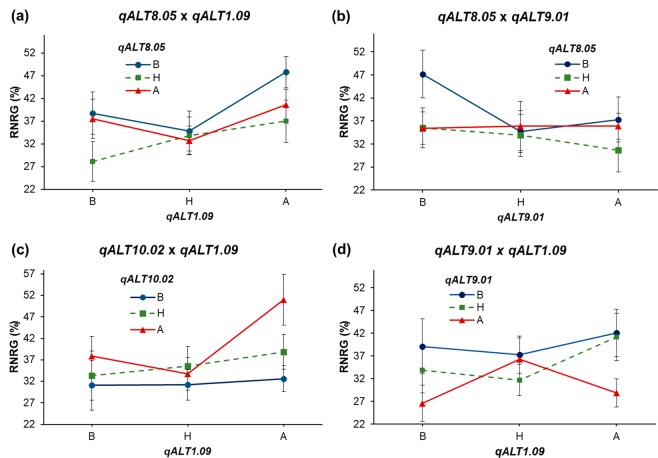
Figure 3.
Al tolerance (RNRG means and standard deviations) for F2:3 progeny showing combinations of alleles at pairs of epistatic QTLs. Progeny homozygous for the allele donated by the Al-sensitive parent, SCH3, are shown in B (blue dot), whereas progeny homozygous for the Al-tolerant parent, 203B-14, are shown in A (red triangle). Means for heterozygous (H) progeny are also shown (green square). Interaction between QTLs (a) qALT8.05 × qALT1.09, (b) qALT8.05 × qALT9.01, (c) qALT10.02 × qALT1.09 and (d) qALT9.01 × qALT1.09.

