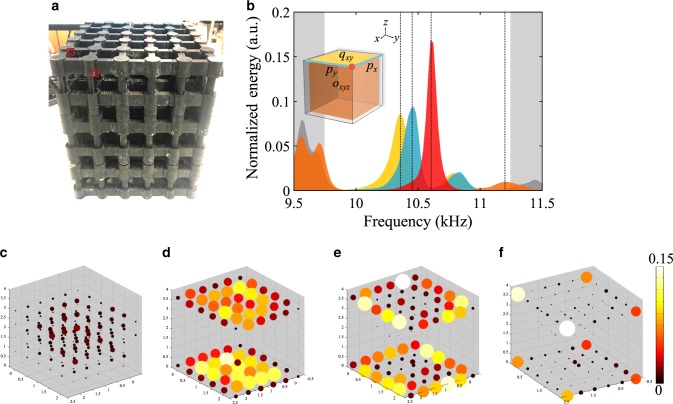
Fig. 3. Experimental demonstration of acoustic octupole TI.
a Photograph of the assembled structure consisting of 3 × 3 × 3 unit cells. Location of probe holes is shown by red squares. b Normalized acoustic frequency-response spectra for the selective bulk (orange), surface (yellow), edge (blue) and corner sites (red) of a finite structure. Gray-colored spectra represent surface and hinge states in the vertical boundaries perpendicular to the yellow-colored surface. Inset is the schematic of selective groups of resonators, in which their respective topologies are shown, like bulk has octupole moment oxyz, top surface has octupole moment , and top edges have dipole moment and . c–f The field profiles of c bulk states, d surface states, e hinge states and f corner states extracted from the frequency responses of all resonators and chosen at selected frequencies indicated by dashed lines in (b).

