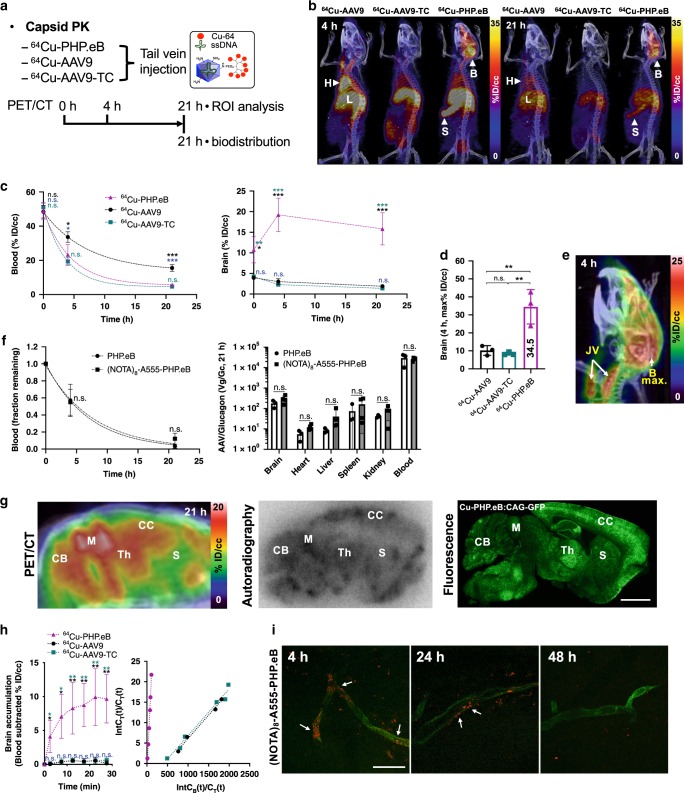
Fig. 3. PET and optical imaging-based assessment of AAV pharmacokinetics in C57BL/6 mice.
a Experimental setup for region of interest (ROI) analysis (0, 4, and 21 h) and biodistribution (21 h) of 64Cu-PHP.eB, -AAV9, and -AAV9-TC. PET images are acquired at 0, 4 and 21 h after AAV tail vein administration. b Projected PET/CT images at 4 (left) and 21 h (right) (H heart, L liver, S spleen, B brain). c Time activity curves (over 21 h) and d maximum brain uptake (at 4 h) of 64Cu-PHP.eB (magenta triangle), 64Cu-AAV9 (black circle), and 64Cu-AAV9-TC (turquoise square) from the ROI analysis of blood and brain (n = 3) after tail vein administration. e Representative projected PET/CT image at 4 h of 64Cu-PHP.eB within the brain (B brain, JV jugular vein). f PK (left) and 21-h biodistribution (right) of PHP.eB (n = 3, black circle) and (NOTA)8-A555-PHP.eB (n = 4, black squares) obtained by qPCR. g Sliced PET/CT, autoradiography and GFP images of sagittal section of mouse brain (CB cerebellum, M midbrain, Th thalamus, CC cerebral cortex, S striatum) acquired at 21 h, 21 h and 3 weeks, respectively, after tail vein injection of 64Cu-PHP.eB for PET/CT and autoradiography and non-radioactive 63Cu-PHP.eB for the GFP image. h 64Cu-AAVs brain accumulation (n = 3 per group) measured 30 min after tail vein administration (left) and Logan plots (right) of brain uptake rate after AAV administration. i Representative confocal images of (NOTA)8-A555-PHP.eB (red) on brain endothelium (green) acquired 4, 24, and 48 h after tail vein injection. White arrows indicate (NOTA)8-A555-PHP.eBs (red). Data are shown as mean ± SD. One-way ANOVA with Tukey’s multiple comparison test (c, d, and h (left)) compared means of the three groups. Multiple unpaired t-tests with the Holm-Sidak method with alpha = 0.05 compared the means in f. Significance: n.s. (not significant), *P ≤ 0.05, **P ≤ 0.01, and ***P ≤ 0.001. P values are shown in the source data. Intensity values in b, d, e, and (g, left) are percent injected dose per cubic centimeter (% ID/cc). Scale bars: 2 mm (g), 25 μm (i).

