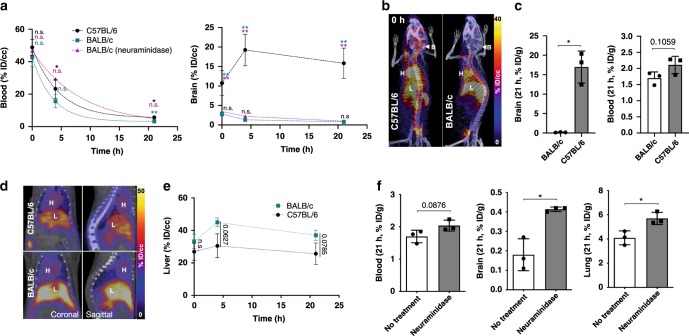
Fig. 4. Strain and neuraminidase-dependent pharmacokinetics of 64Cu-PHP.eB.
a Time activity curves of PHP.eB obtained from region of interest (ROI) analysis of blood (left) and brain (right) from C57BL/6 (black circle), BALB/c (turquoise square), and neuraminidase-treated BALB/c (magenta triangle) mice over 21 h (n = 3 per group). Radioactivity from ROI analysis is presented as % ID/cc. b Representative PET/CT projection images (B brain, H heart, L liver) acquired over 30 min after tail vein injection of 64Cu-PHP.eB to C57BL/6 and BALB/c mice. c Biodistribution (% ID/g) of 64Cu-PHP.eB in brain (left) and blood (right) in C57BL/6 (gray bar with black squares) and BALB/c (white bar with black circle) mice at 21 h (n = 3). d Sliced PET/CT image (H heart, L liver) at 4 h after tail vein injection of 64Cu-PHP.eB. e Time activity curve of 64Cu-PHP.eB measured from C57BL/6 (black circle) and BALB/c (turquoise square) livers (n = 3). f Biodistribution (21 h) of 64Cu-PHP.eB in blood (left), brain (middle), and lung (right) from BALB/c with no treatment white bar with black circle) versus BALB/c mice treated with neuraminidase (gray bar with black square) (n = 3). Data are shown as mean ± SD. For statistical analysis, a one-way ANOVA with Tukey’s multiple comparison test in a was performed to compare means of three groups (C57BL/6 vs BALB/c: turquoise, C57BL/6 vs BALB/c (neuraminidase): magenta, BALB/c vs BALB/c (neuraminidase): black) at each time point. Unpaired two-tailed Welch’s t-test was performed in c, (e, 0, 4, and 21 h) and f. Significance is presented as *P ≤ 0.05, **P ≤ 0.01. P values are shown in the source data. Maximum and minimum intensity values of PET/CT images in b, d are presented as percent injected dose per cubic centimeter (% ID/cc).

