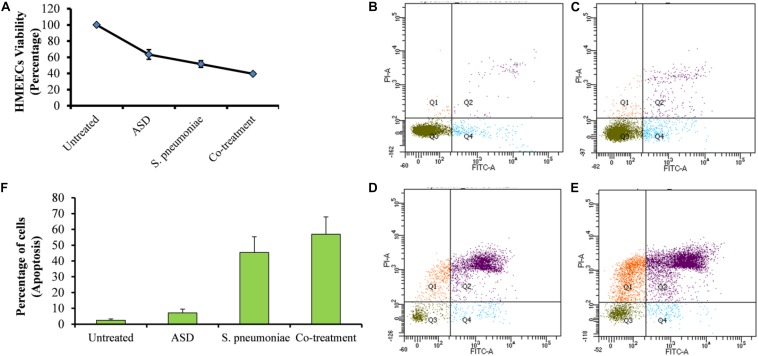
FIGURE 5.
The viability of HMEECs and apoptosis upon ASD or S. pneumoniae treatment or co-treatment. (A) Cell viability results are represented as the percentage of viable cells compared to the untreated cells (100%). The error bars represent the standard deviation. (B) Apoptosis of HMEECs in control, (C) apoptosis of HMEECs upon ASD treatment, (D) apoptosis upon S. pneumoniae treatment, and (E) apoptosis of HMEECs upon co-treatment, detected by annexin-V/PI double staining and cytometry analysis. (F) Percentage of HMEECs undergoing early and late apoptosis.

