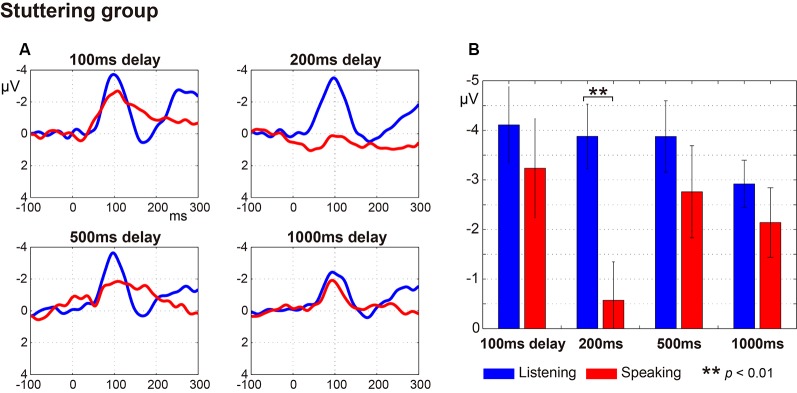
Figure 3.
Auditory evoked potentials in the stuttering group. (A) Averaged auditory evoked potential under each delayed auditory feedback (DAF) time condition. The blue line represents the Listening task and the red line represents the Speaking task. (B) N1 amplitude extracted from each participant’s auditory evoked potential. Graphs represent mean ± SEM. Only the 200 ms delay condition showed a significant difference in comparison with Tukey’s HSD test between the N1 amplitude for Listening and Speaking conditions (p < 0.01).

