
Figure 2.
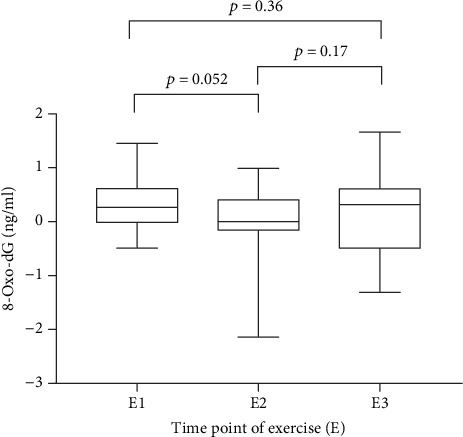
Represents increment of 8-oxo-dG as median and ranges where the 8-oxo-dG values before exercise have been subtracted from the values after 20 minutes of exercise. E1: 8-oxo-dG increment induced by physical activity; E2: 8-oxo-dG increment by physical activity after three weeks of juice intake; E3: 8-oxo-dG increment after the washout period.