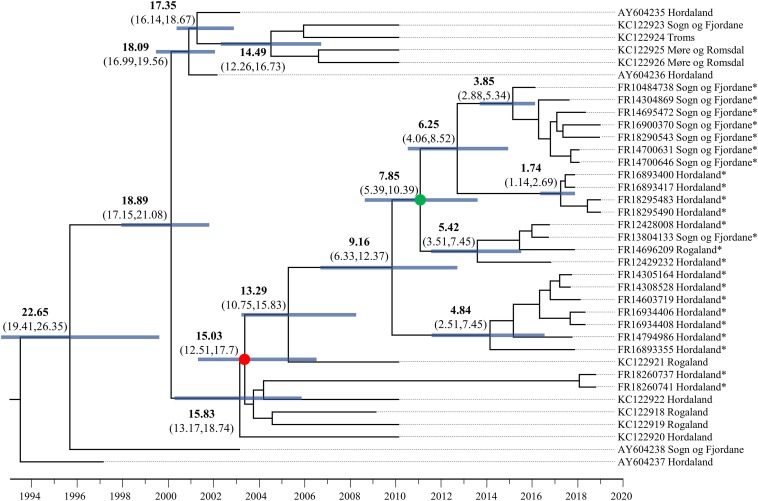
FIGURE 2.
Dated phylogenetic tree of SAV3 built from an 11,681 alignment and analyzed in BEAST2 using the best fit nucleotide substitution model (TIM2 + G4), a relaxed molecular clock model, tip-dating, and a coalescent Bayesian Skyline population model. The values on branches indicate years before 2019 in bold, and the 95% highest posterior density (HPD) values in brackets. Node bars represent 95% HPD age range. Key nodes are indicated with colored circles: the green-colored node is the common ancestor of the Sogn og Fjordane and Rogaland samples in this study, and the red-colored node represents the common ancestor of all samples sequenced in this study. Strains sequenced in this study are indicated by an *.

