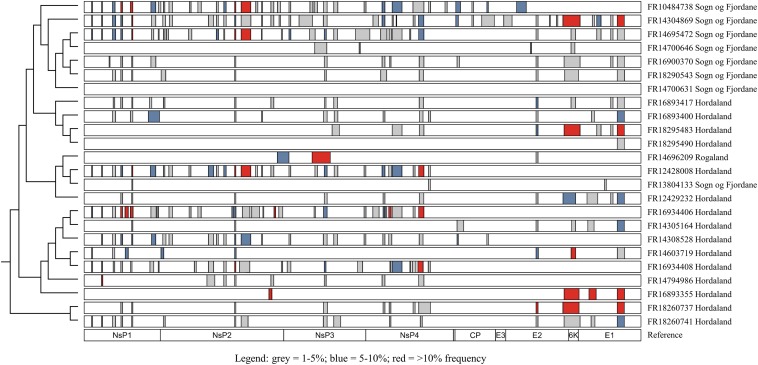
FIGURE 3.
Distribution of deletions (≥10 bp) throughout the SAV3 genome of isolates sequenced on the MinION platform. Only deletions with >50 supporting reads were considered, and all deletions were manually inspected to reduce the rate of false-positive calls. Bars indicate regions with a deletion and are colored by estimated frequency. Isolates are plotted according to phylogenetic relationships shown elsewhere in this study (Figure 1) and the genomic position of each gene is used as a reference.

