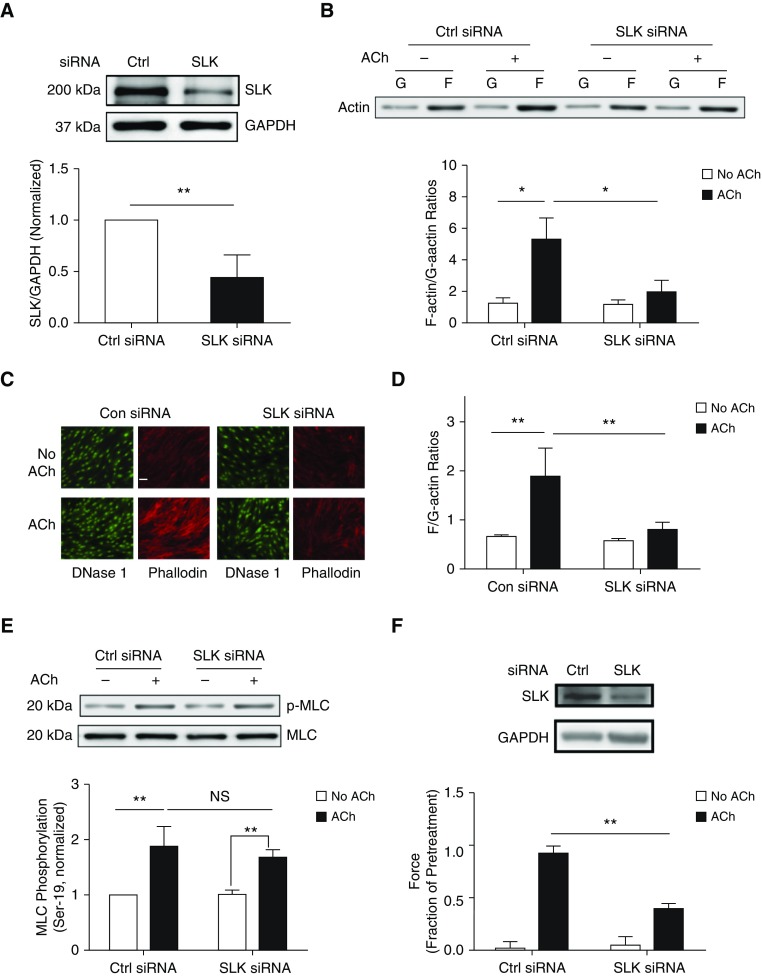
Figure 1.
Ste20-like kinase (SLK) regulates actin polymerization and smooth muscle contraction without affecting myosin light chain phosphorylation at Ser-19. (A) Human airway smooth muscle (HASM) cells were treated with control (Ctrl or Con) or SLK siRNA for 2 days. Protein expression in these cells was evaluated by IB. Data are mean values of experiments using five batches of cell culture from three donors. Error bars indicate SD. (B) HASM cells treated with Ctrl or SLK siRNA were stimulated with 10−4 M acetylcholine (ACh) for 5 minutes or left unstimulated. F-actin/G-actin ratios in cells were evaluated using the fractionation assay. Data are mean values from six batches of cell culture from three donors. Error bars indicate SD. (C and D) Fluorescent images illustrating the effects of SLK knockdown (KD) on F/G-actin ratios in HASM cells. Phalloidin was used to detect F-actin, whereas DNase I was used to detect G-actin. SLK KD attenuates F/G-actin ratios on stimulation with ACh (10−4 M, 5 min). Data are means ± SD (n = 23–30 images from three independent experiments). Scale bar: 30 μm. (E) Myosin light chain (MLC) phosphorylation (p) at Ser-19 in cells treated with Ctrl or SLK siRNA was assessed by immunoblot analysis. Basal and ACh (10−4 M, 5 min) -induced myosin phosphorylation was similar in cells expressing Ctrl siRNA or SLK siRNA. NS = not significant. Data are mean values from four batches of cell culture from three donors. Error bars indicate SD. (F) Immunoblots showing the effects of SLK siRNA on SLK expression in human bronchial tissues. Blots are representative of three identical experiments. Contraction of human bronchial rings to ACh was evaluated, after which siRNA was introduced into tissues by reversible permeabilization. Contractile responses (ACh, 10−4 M, 5 min) were compared before and after incubation. Passive tension is normalized to the ACh-induced contractile response before incubation. Data are mean values of six samples from three donors. Error bars indicate SD. *P < 0.05 and **P < 0.01. Student’s t-test was used for statistical analysis of A and F. Two-way ANOVA was used for statistical analysis of B, D, and E.

