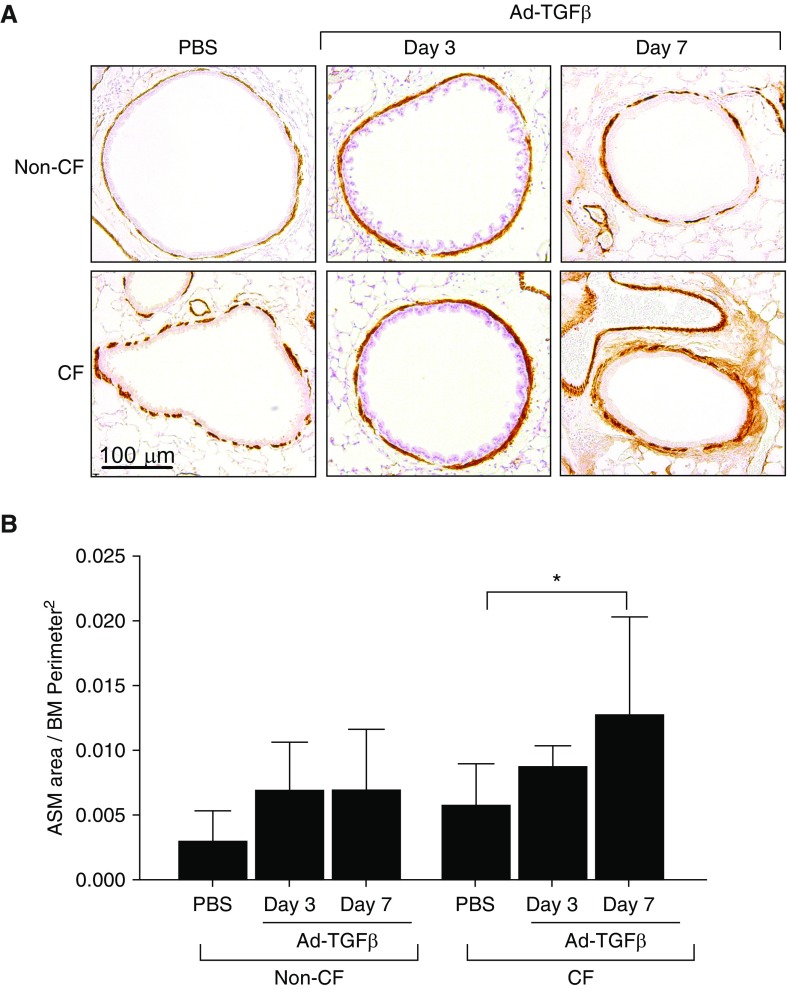
Figure 3.
(A) Immunohistochemistry for ACTA2-smooth muscle actin (αSMA) demonstrated airway smooth muscle (ASM) (brown) around airways in PBS control and Ad-TGFβ–treated CF and non-CF mice. Scale bar: 100 μm. (B) Quantification of αSMA area, corrected to basement membrane (BM) perimeter squared, demonstrated that TGFβ exposure significantly increased ASM area at Day 7 in CF mice only. *P < 0.05 by one-way ANOVA with Tukey’s post hoc analysis. Data are presented as mean ± SD.

