. 2020 Mar 25;37(1):25–30. doi: 10.5511/plantbiotechnology.19.1209a

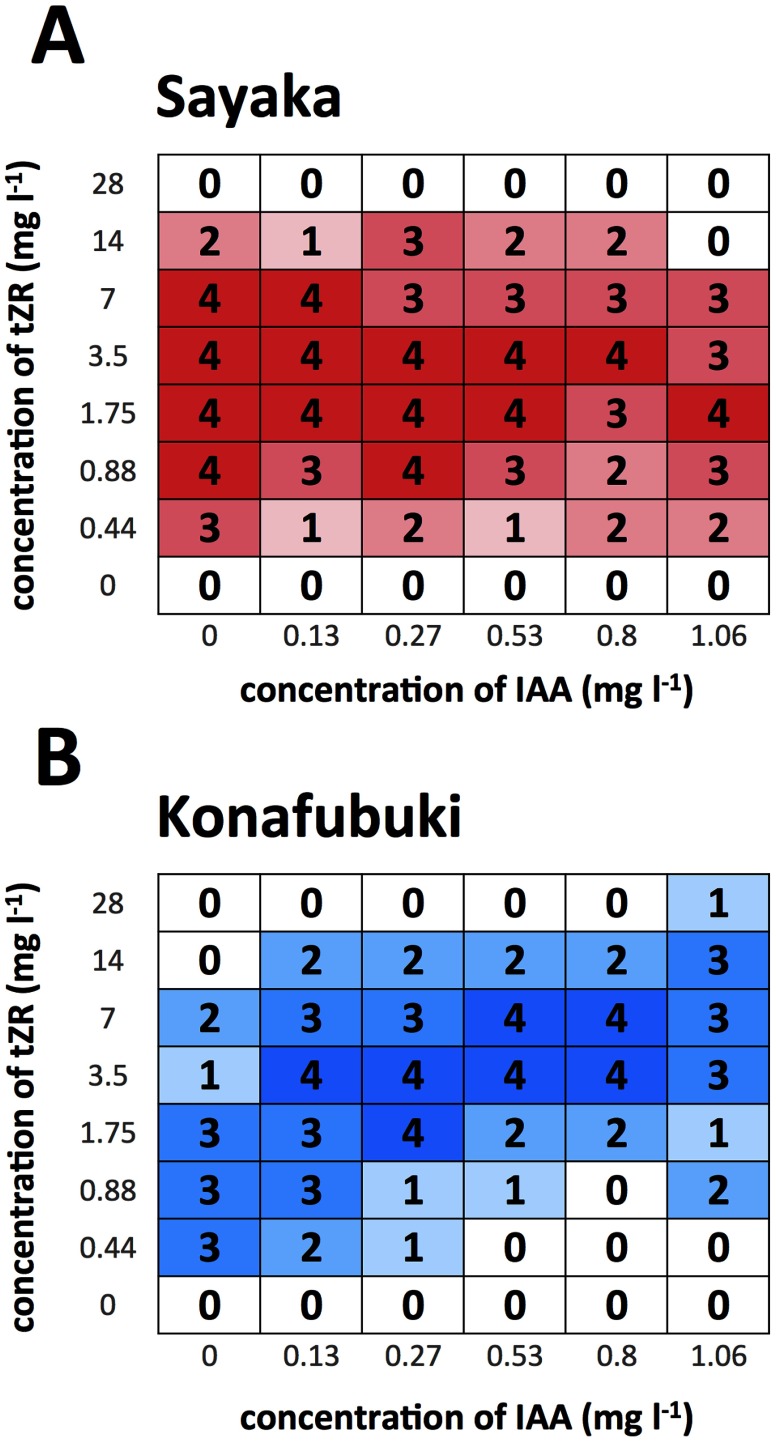
Figure 3. Heat map of the shoot formation frequency for the cultured cells of ‘Sayaka’ (A) and ‘Konafubuki’ (B). The occurrence of regeneration was determined using the assay method as shown in the previous figures. When the regenerated shoots were observed on one of the two tissues, it was counted as ‘regenerated’. This assay was performed four times each, and numbers of ‘regenerated’ in total are indicated as the frequency of regeneration. In each box, frequency is shown as the total number as ‘regenerated’ events, with color gradation.

Figure 3. Heat map of the shoot formation frequency for the cultured cells of ‘Sayaka’ (A) and ‘Konafubuki’ (B). The occurrence of regeneration was determined using the assay method as shown in the previous figures. When the regenerated shoots were observed on one of the two tissues, it was counted as ‘regenerated’. This assay was performed four times each, and numbers of ‘regenerated’ in total are indicated as the frequency of regeneration. In each box, frequency is shown as the total number as ‘regenerated’ events, with color gradation.