. 2020 Mar 25;37(1):25–30. doi: 10.5511/plantbiotechnology.19.1209a

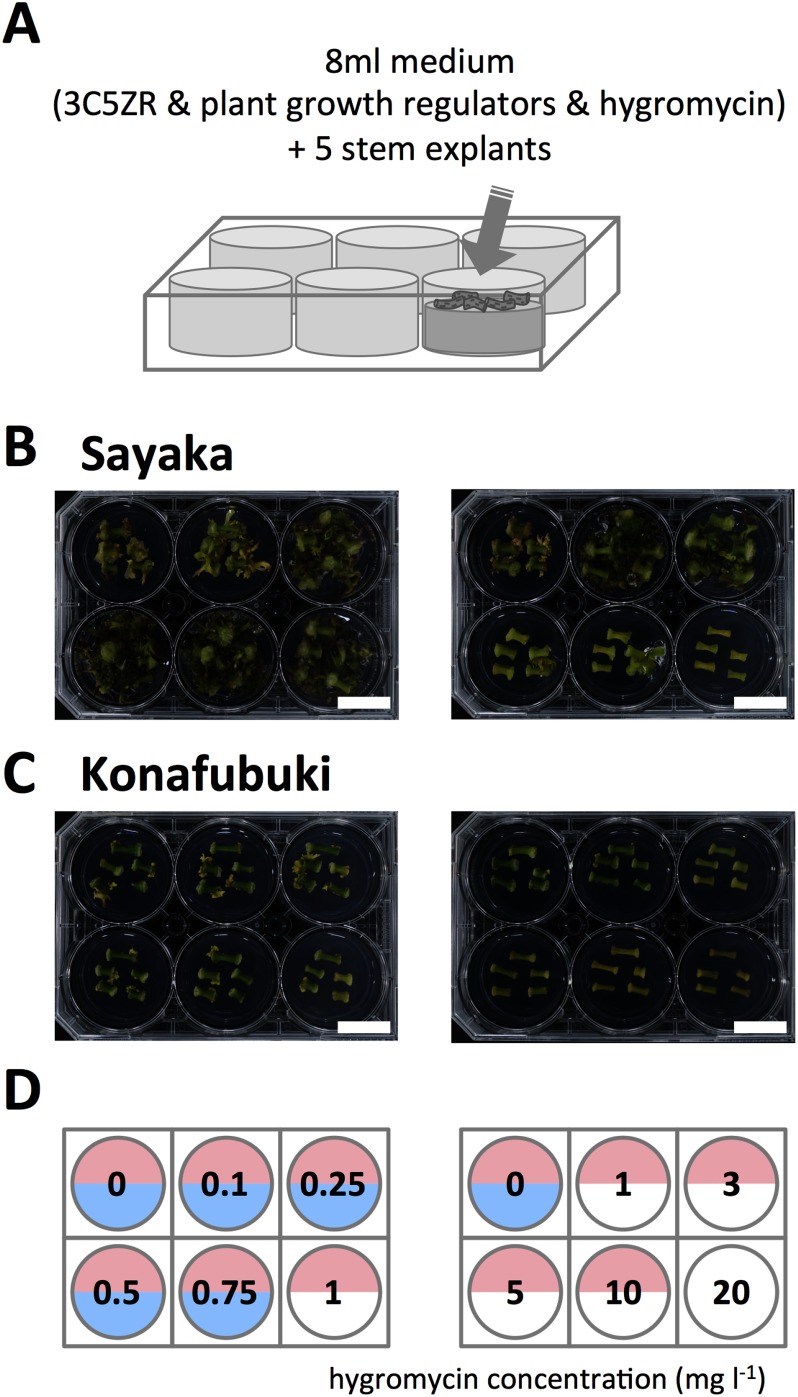
Figure 5. Assay for sensitivity to hygromycin. (A) Schematic representation of the procedure for the determination of sensitivity. Sections of potato stems were placed in a 6-well plate and cultured for 30 days. The wells contained a series of hygromycin concentrations (0 to 20 mg l−1). (B, C) Representative images of cultured cells of ‘Sayaka’ (B) and ‘Konafubuki’ (C). The hygromycin concentrations in the medium is indicated in panel (D). (D) Summary of sensitivity of ‘Sayaka’ and ‘Konafubuki’ to hygromycin. The numbers on the panel indicate the hygromycin concentration in the medium. When shoot regeneration was detected, the corresponding half circles are colored. The results for ‘Sayaka’ and ‘Konafubuki’ are shown in the upper and lower half circles, respectively. Scale bars indicate 2 cm.

Figure 5. Assay for sensitivity to hygromycin. (A) Schematic representation of the procedure for the determination of sensitivity. Sections of potato stems were placed in a 6-well plate and cultured for 30 days. The wells contained a series of hygromycin concentrations (0 to 20 mg l−1). (B, C) Representative images of cultured cells of ‘Sayaka’ (B) and ‘Konafubuki’ (C). The hygromycin concentrations in the medium is indicated in panel (D). (D) Summary of sensitivity of ‘Sayaka’ and ‘Konafubuki’ to hygromycin. The numbers on the panel indicate the hygromycin concentration in the medium. When shoot regeneration was detected, the corresponding half circles are colored. The results for ‘Sayaka’ and ‘Konafubuki’ are shown in the upper and lower half circles, respectively. Scale bars indicate 2 cm.