. 2020 Mar 25;37(1):83–88. doi: 10.5511/plantbiotechnology.19.1227a

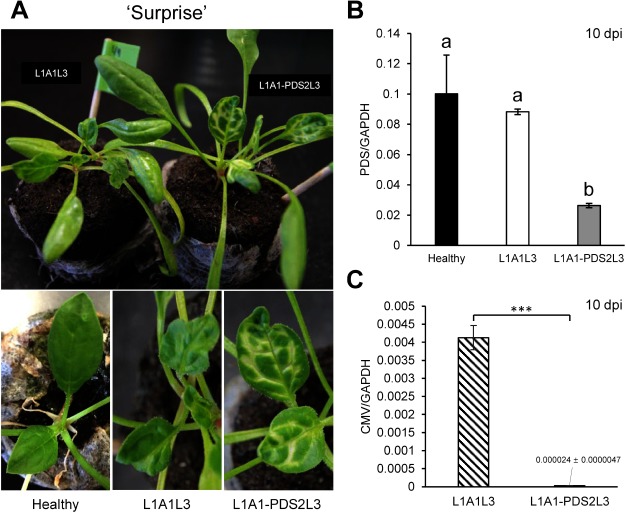
Figure 3. VIGS against the PDS gene in the spinach cultivar ‘Surprise.’ (A) Photobleaching observed on the upper leaves of spinach inoculated with L1A1-PDS2L3 at 10 dpi. The pictures of leaves of healthy plants and empty vector-infected plants are shown for comparison. (B) PDS expression levels in the upper non-inoculated leaves at 10 dpi. Real-time RT-PCRs were conducted using primer pairs as in Supplementary Table S1. Statistical analysis for real-time RT-PCR of PDS was conducted using Tukey’s multiple comparison test (* p<0.05); different letters above the bars indicate a significant difference among isolates. (C) CMV accumulation levels in upper non-inoculated leaves at 10 dpi. Real-time RT-PCR was conducted as explained in Figure 2. Statistical analysis was performed using Student’s t-test (*** p<0.001).

Figure 3. VIGS against the PDS gene in the spinach cultivar ‘Surprise.’ (A) Photobleaching observed on the upper leaves of spinach inoculated with L1A1-PDS2L3 at 10 dpi. The pictures of leaves of healthy plants and empty vector-infected plants are shown for comparison. (B) PDS expression levels in the upper non-inoculated leaves at 10 dpi. Real-time RT-PCRs were conducted using primer pairs as in Supplementary Table S1. Statistical analysis for real-time RT-PCR of PDS was conducted using Tukey’s multiple comparison test (* p<0.05); different letters above the bars indicate a significant difference among isolates. (C) CMV accumulation levels in upper non-inoculated leaves at 10 dpi. Real-time RT-PCR was conducted as explained in Figure 2. Statistical analysis was performed using Student’s t-test (*** p<0.001).