. 2020 Mar 25;37(1):83–88. doi: 10.5511/plantbiotechnology.19.1227a

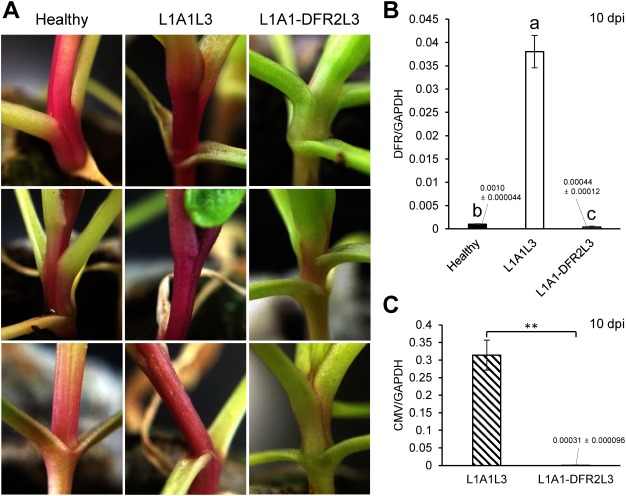
Figure 4. Expected silencing phenotype (decoloration) observed in the stem of spinach inoculated with L1A1-DFR2L3 at 10 dpi. The set of pictures is VIGS against the DFR gene in the red-purple spinach cultivar ‘Kuroshio.’ The pictures of the stems from three individual plants (healthy plants and L1A1L3-infected plants) are shown for comparison. The GAPDH gene was used as a reference gene. (B) Real-time RT-PCR was conducted using primer pairs as in Supplementary Table S1. To maintain homogeneity of variance among the sample groups, the raw data was converted to log data for the statistical analysis. Means (±SE) among the infected plants were analyzed for significant differences using Tukey’s multiple comparison test (* p<0.05); different letters above the bars indicate a significant difference among isolates. (C) Comparison of viral accumulation by real-time RT-PCR. Total RNA was extracted from stem. Real-time RT-PCR was conducted as explained in Figure 2. Statistical analysis was performed using Student’s t-test (** p<0.01).

Figure 4. Expected silencing phenotype (decoloration) observed in the stem of spinach inoculated with L1A1-DFR2L3 at 10 dpi. The set of pictures is VIGS against the DFR gene in the red-purple spinach cultivar ‘Kuroshio.’ The pictures of the stems from three individual plants (healthy plants and L1A1L3-infected plants) are shown for comparison. The GAPDH gene was used as a reference gene. (B) Real-time RT-PCR was conducted using primer pairs as in Supplementary Table S1. To maintain homogeneity of variance among the sample groups, the raw data was converted to log data for the statistical analysis. Means (±SE) among the infected plants were analyzed for significant differences using Tukey’s multiple comparison test (* p<0.05); different letters above the bars indicate a significant difference among isolates. (C) Comparison of viral accumulation by real-time RT-PCR. Total RNA was extracted from stem. Real-time RT-PCR was conducted as explained in Figure 2. Statistical analysis was performed using Student’s t-test (** p<0.01).