
FIGURE 3.
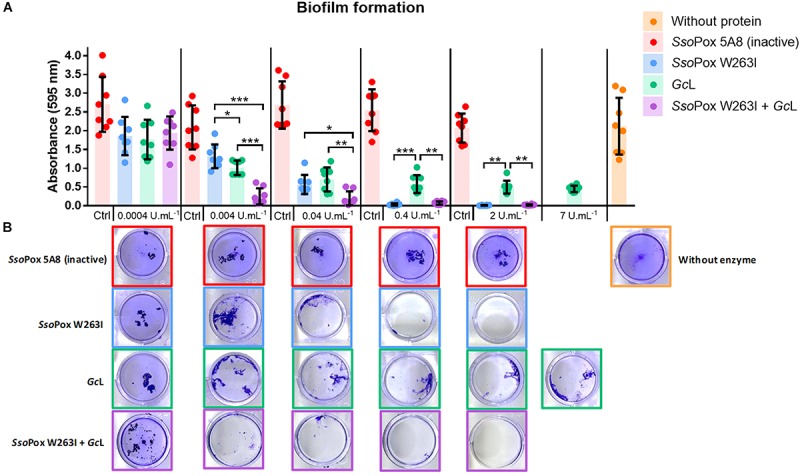
Biofilm formation is reduced by GcL and undetectable with SsoPox W263I. (A) Biofilm formation was measured using crystal violet staining. For each active enzyme or their mixture, an equivalent activity on 3-oxo-C12 HSL was used. The inactive variant SsoPox 5A8 was used at the same protein quantity as SsoPox W263I. All n = 8 independent samples are plotted with their mean and standard deviation as colored histograms and black bars. Statistical significance according to Holm-Sidak’s multiple comparison test are highlighted by black stars (multiplicity adjusted pvalue < 0.05*, < 0.01**, < 0.001***). (B) Corresponding pictures of crystal violet stained biofilm after lactonase treatment for each concentration and conditions.