
Figure 3. Donor-reactive cTfh cells exhibit an activated ICOS+PD-1+ phenotype after transplantation.
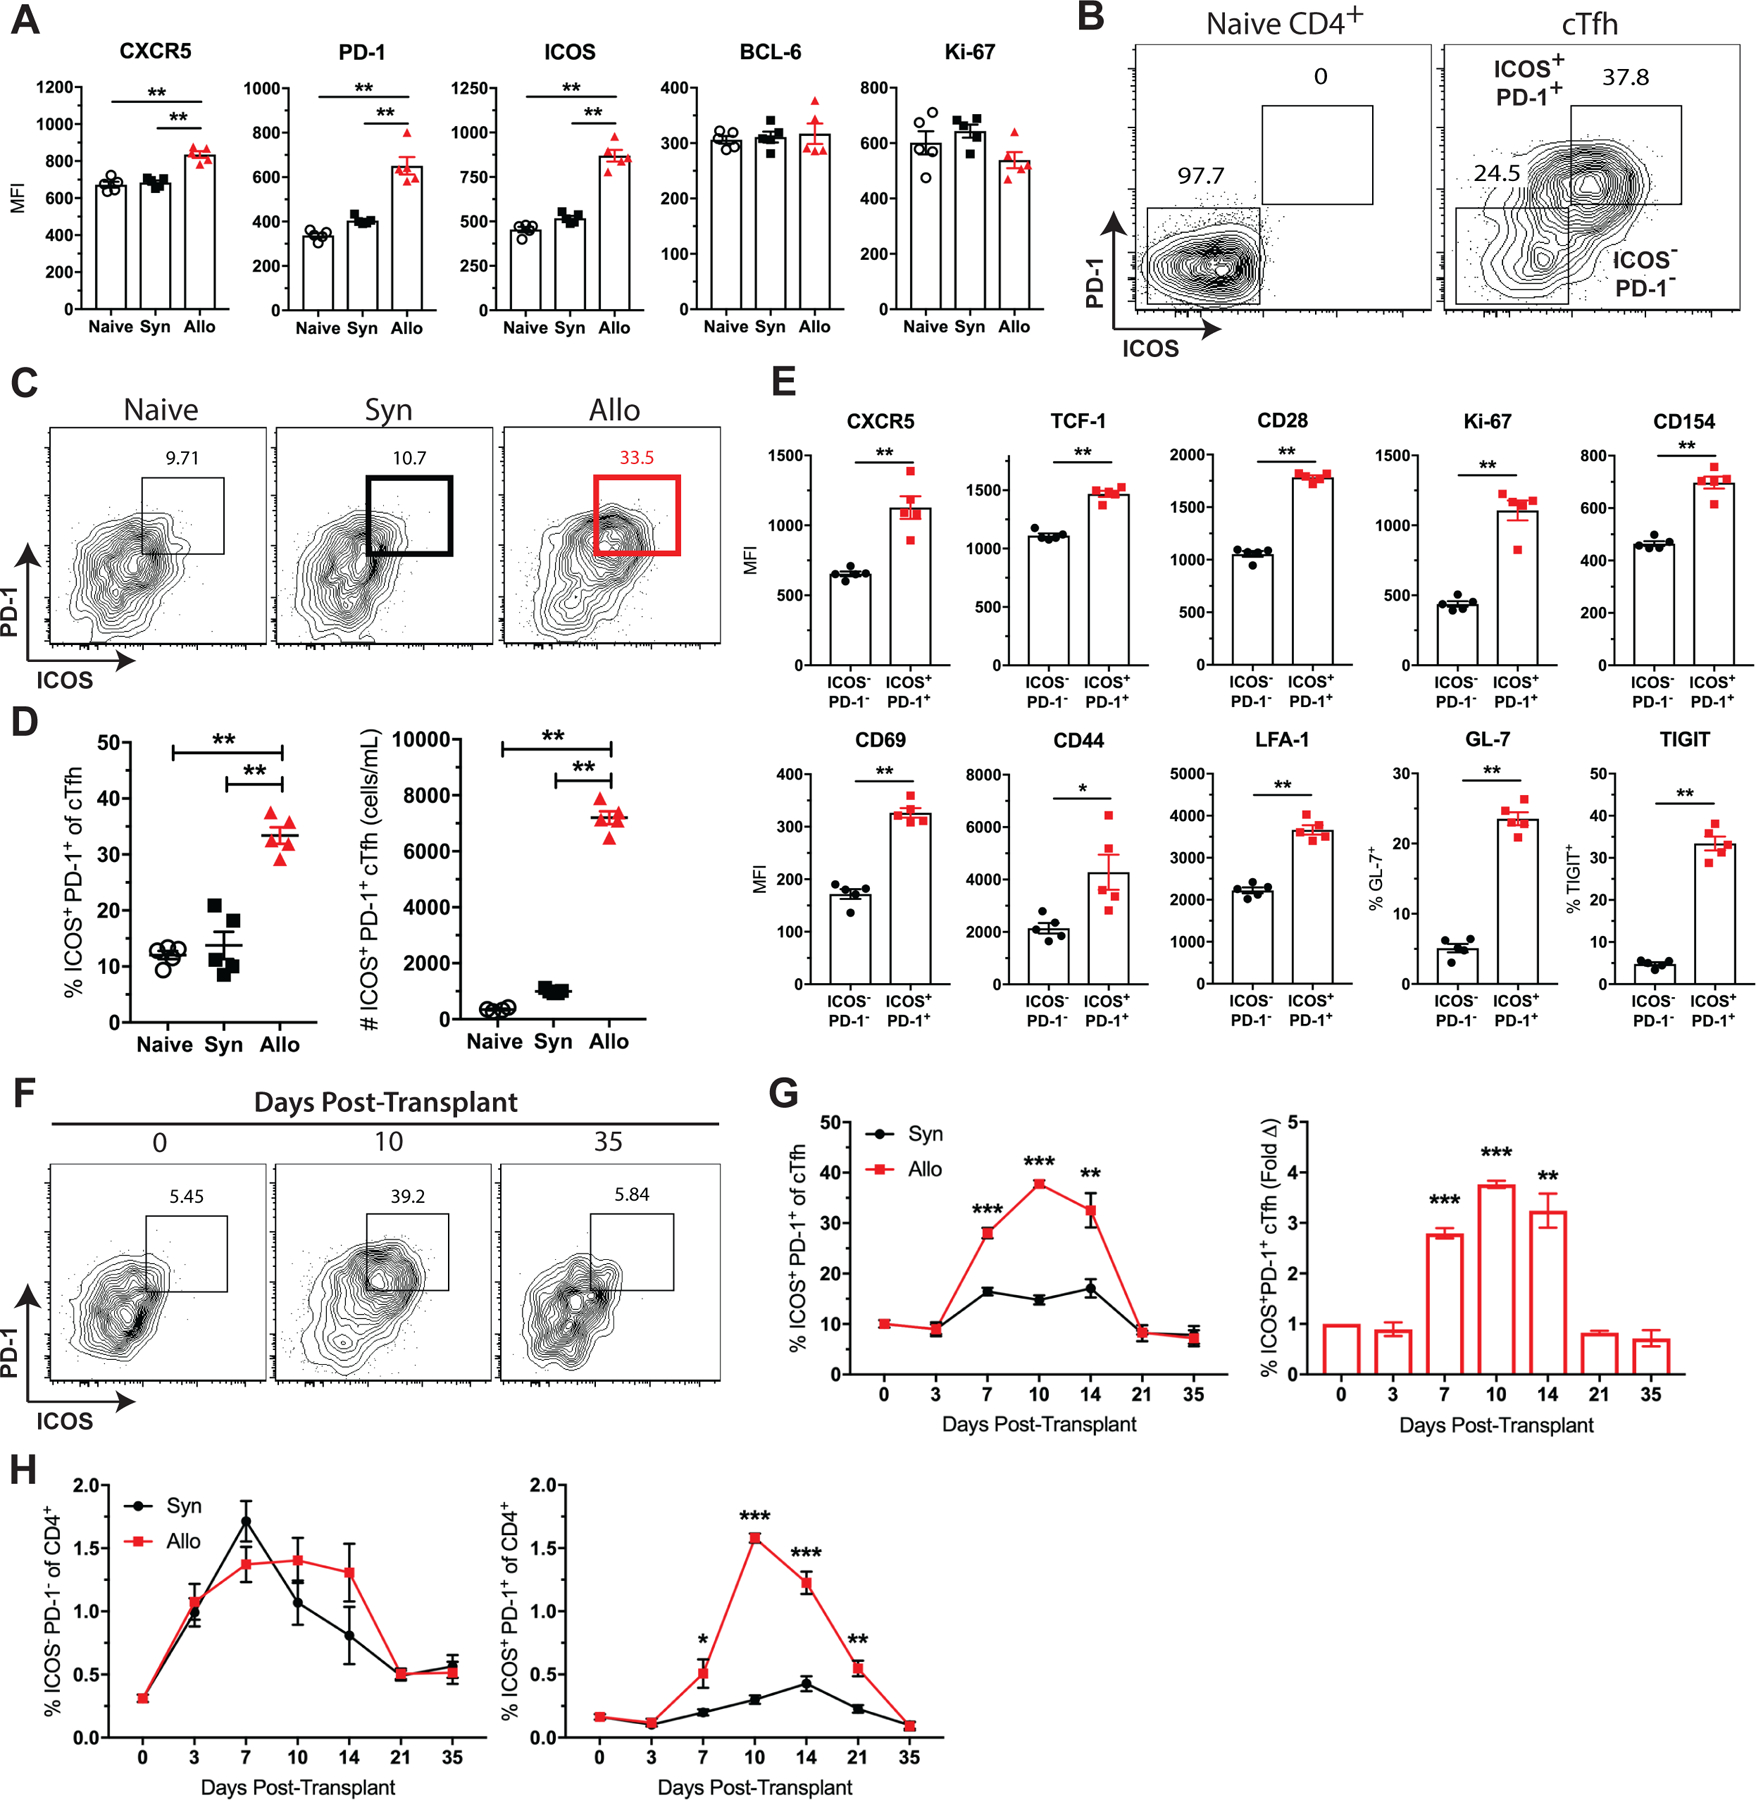
Naïve B6 mice were transplanted with skin from either B6 (Syn) or BALB/c (Allo) donors and sacrificed for PBMC analysis. (A) Summary data of phenotypic marker expression on cTfh cells from naïve, syngeneic and allogeneic skin-grafted mice ten days after transplant (n=5 per group). (B) Representative flow plots depicting ICOS and PD-1 expression on naïve (CD44loCD62L+) CD4+ T cells and CXCR5+ cTfh cells. (C) Representative flow plots (gated on CD4+Foxp3−CXCR5+ T cells) displaying the frequencies of ICOS+PD-1+ cTfh cells. (D) Summary data of the frequencies and numbers of ICOS+PD-1+ cTfh cells (n=5 per group). (E) Summary data of phenotypic marker expression on ICOS−PD-1− and ICOS+PD-1+ cTfh cells (n=5 per group). (F) Representative flow plots (gated on CD4+CXCR5+ T cells) displaying the frequencies of ICOS+PD-1+ cTfh cells over time. (G) Summary data of ICOS+PD-1+ cTfh cell frequencies and fold change over time (n=5 per group). (H) Summary data of ICOS−PD-1− and ICOS+PD-1+ cTfh cell frequencies of CD4+ T cells over time. Summary data represent mean (SE) and are representative of 3–4 independent experiments with a total of 15–20 mice per group. *p < 0.05, **p < 0.01, ***p< 0.001.