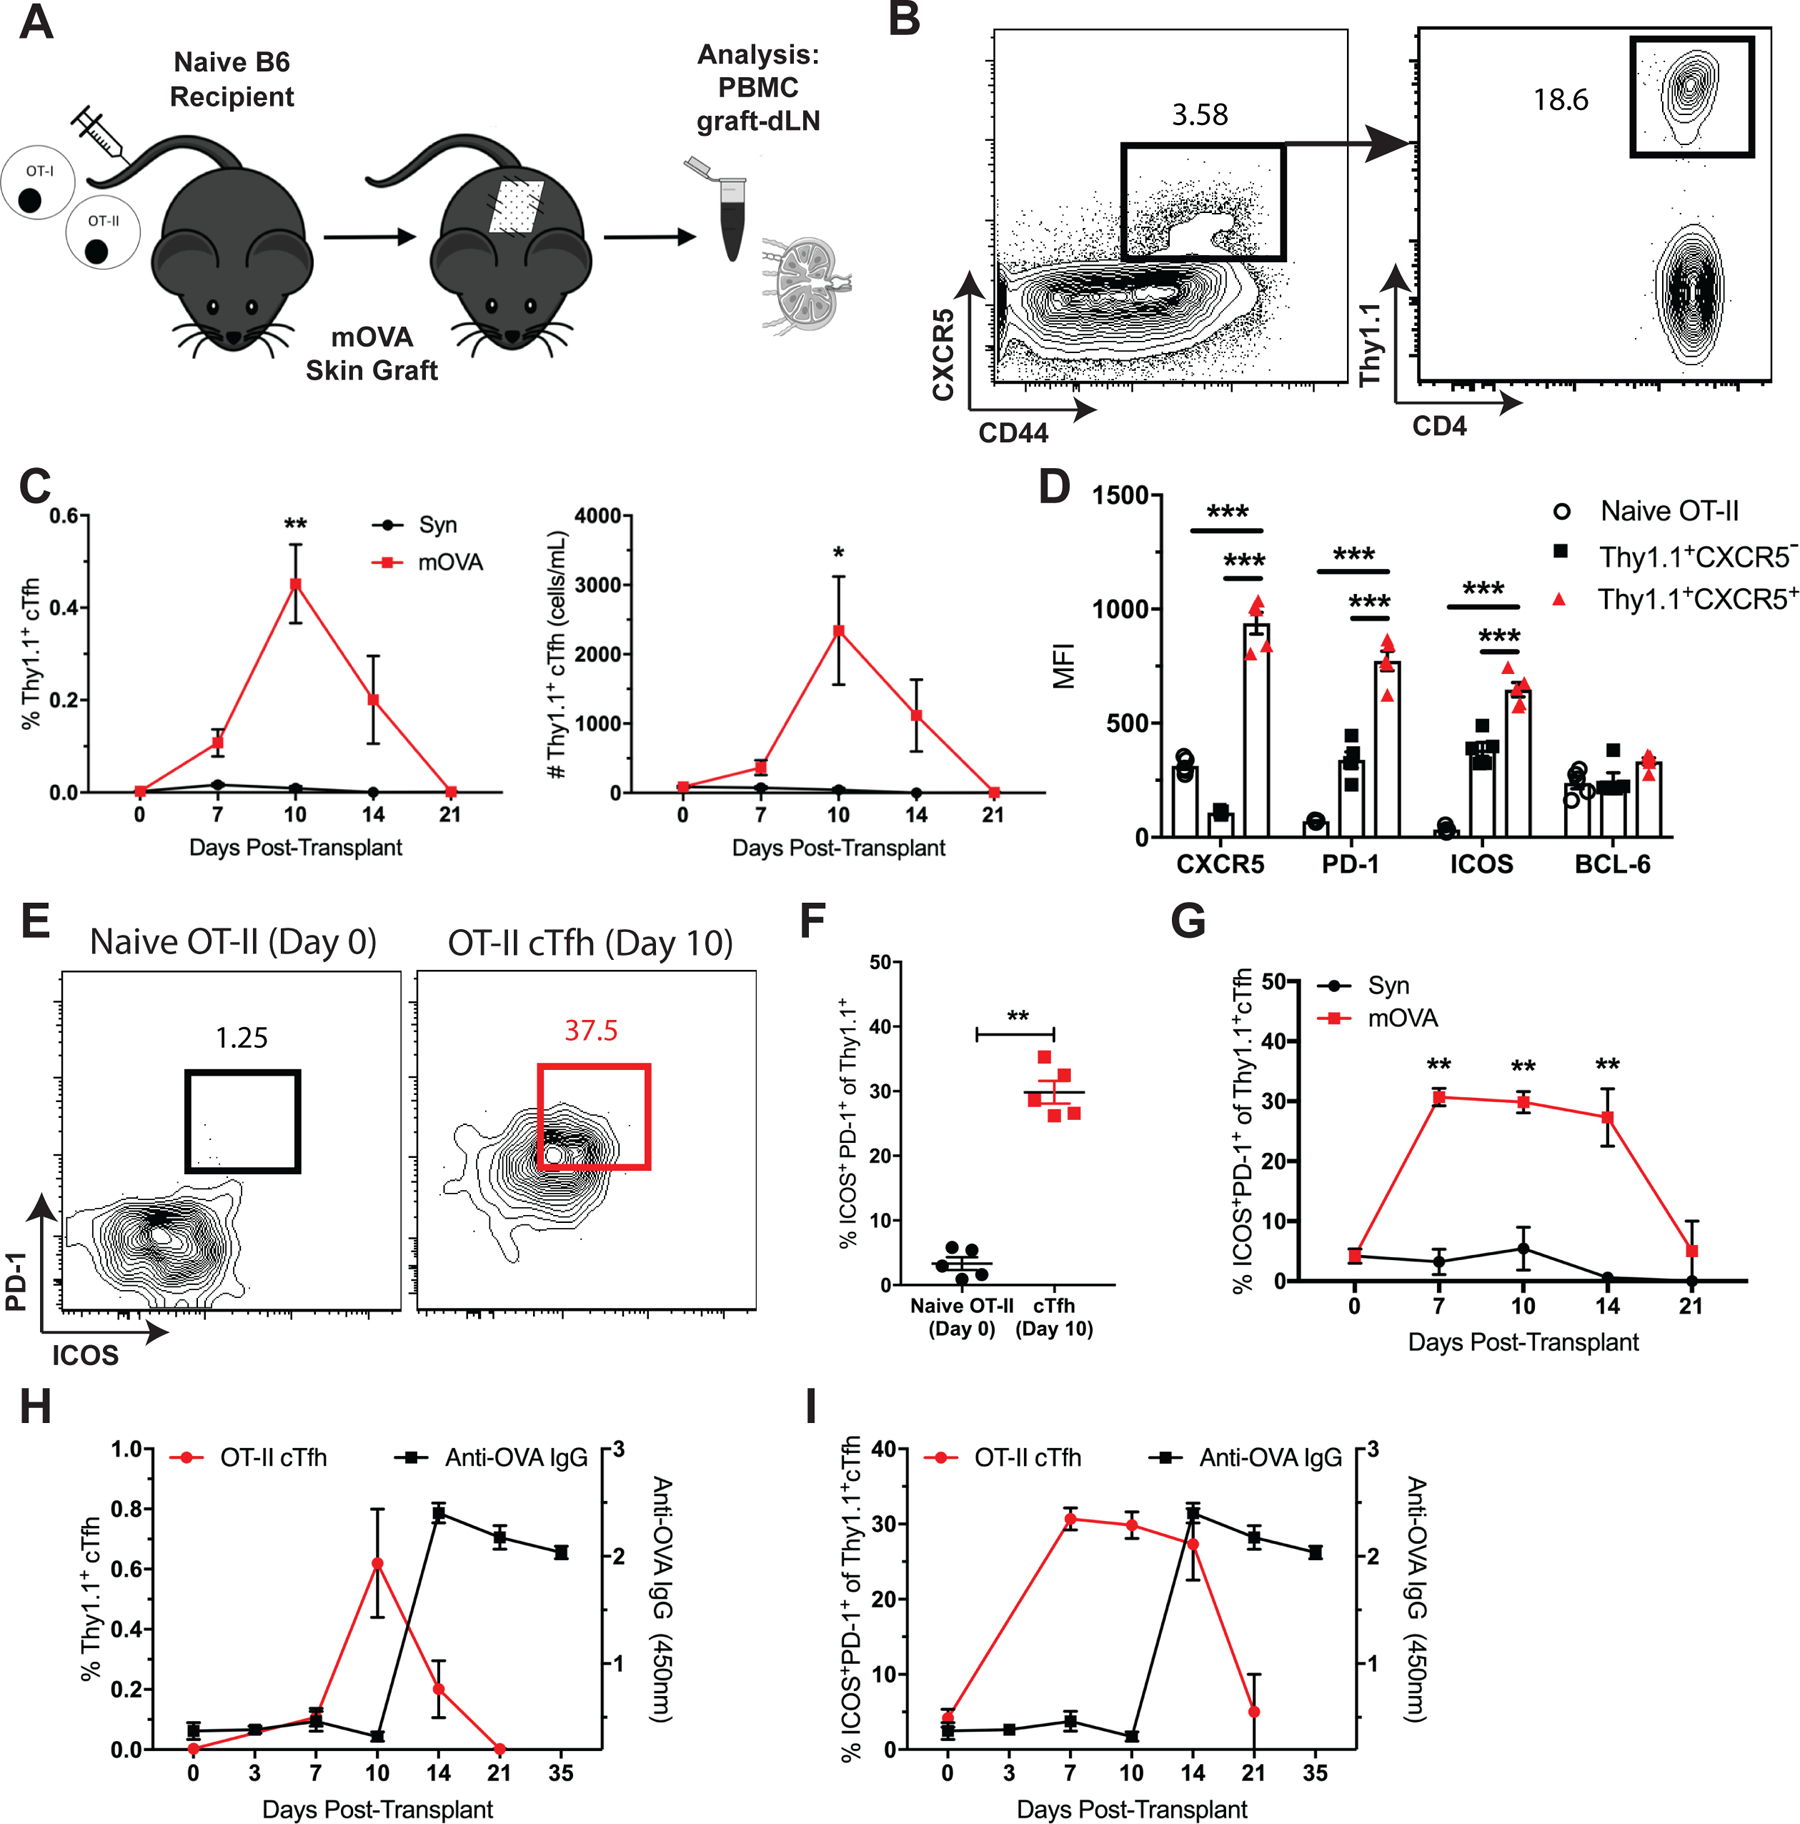
Figure 5. Antigen-specific TCR transgenic cTfh cells display similar phenotypic characteristics and kinetics to endogenous alloreactive cTfh cells following transplantation.

(A) Naïve B6 mice were adoptively transferred 106 of each Thy1.1+ CD4+ OT-II and CD8+ OT-I T cells, transplanted skin from B6 (Syn) or mOVA donors and sacrificed at indicated time points post-transplantation for PBMC, graft-dLN and serum analyses. (B) Flow plots (gated on CD4+Foxp3− T cells) depict gating strategy for CXCR5+Thy1.1+ OVA-specific cTfh cells. (C) Summary data of Thy1.1+ cTfh cell frequencies and numbers following B6 (Syn) or mOVA skin transplantation over time (n=5 per group). (D) Summary data of phenotypic marker expression in naïve (CD44loCD62L+) OT-II cells, and Thy1.1+ CXCR5− or CXCR5+ OT-II cells from the peripheral blood 10 days post-transplantation (n=5 per group). (E) Flow plots depicting ICOS and PD-1 expression on naive OT-II cells on day 0 and Thy1.1+CXCR5+ cTfh cells 10 days post-transplantation. (F) Summary data of the frequencies of ICOS+PD-1+ of naïve OT-II cells on day 0 and Thy1.1+ cTfh cells 10 days after transplant (n=5 per group). (G) Summary data of ICOS+PD-1+ Thy1.1+ cTfh cell frequencies over time (n=5 per group). Summary data of (H) Thy1.1+ cTfh cell and (I) ICOS+PD-1+ Thy1.1+ cTfh cell frequencies relative to anti-OVA IgG formation over time (n=5 per group). Summary data represent mean (SE) and are representative of three independent experiments with a total of 10–15 mice per group. *p < 0.05, **p < 0.01, ***p< 0.001.
