
Figure 5a:
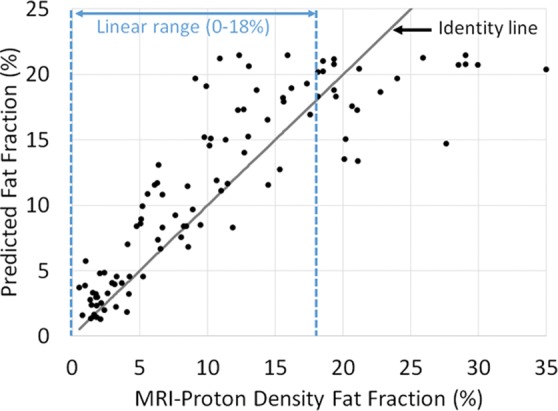
Predicted fat fraction versus MRI-derived proton density fat fraction obtained by using radiofrequency signals (a) without and (b) with time gain compensation. Blue lines represent the linear range. Gray line represents the identity line.
Official websites use .gov
A
.gov website belongs to an official
government organization in the United States.
Secure .gov websites use HTTPS
A lock (
) or https:// means you've safely
connected to the .gov website. Share sensitive
information only on official, secure websites.
Predicted fat fraction versus MRI-derived proton density fat fraction obtained by using radiofrequency signals (a) without and (b) with time gain compensation. Blue lines represent the linear range. Gray line represents the identity line.