
Figure 6a:
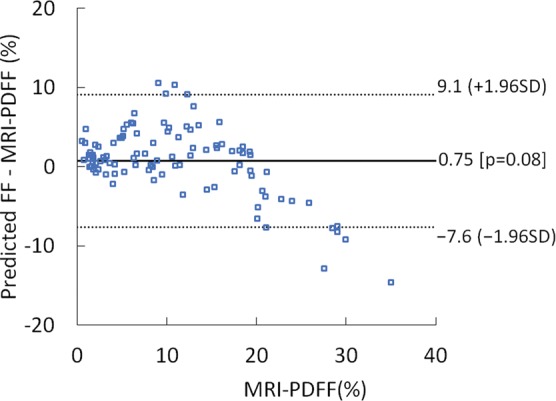
Difference between predicted fat fraction (FF) and MRI-derived proton density fat fraction (PDFF) versus the MRI-derived PDFF plots obtained by using radiofrequency signals (a) without and (b) with time gain compensation. SD = standard deviation.