
Fig. 7. SsnB treatment decreases proliferation and induces apoptosis in hepatic stellate cells.
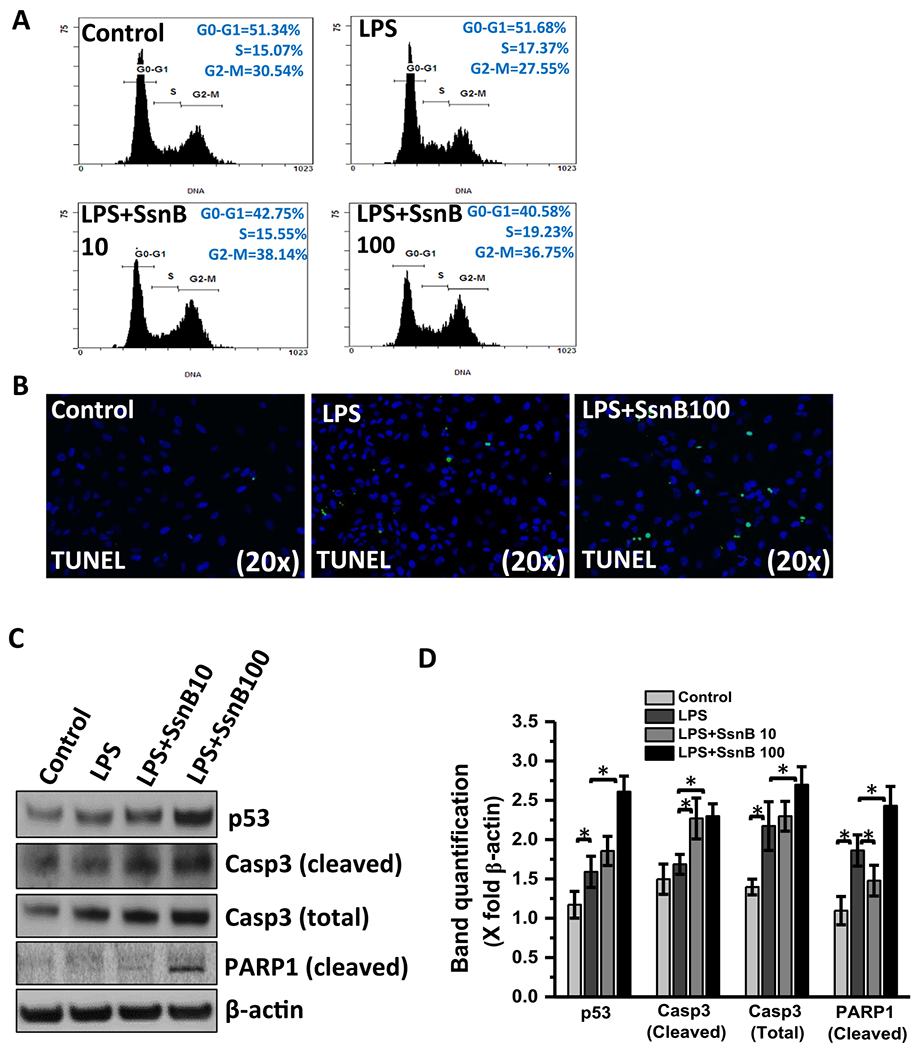
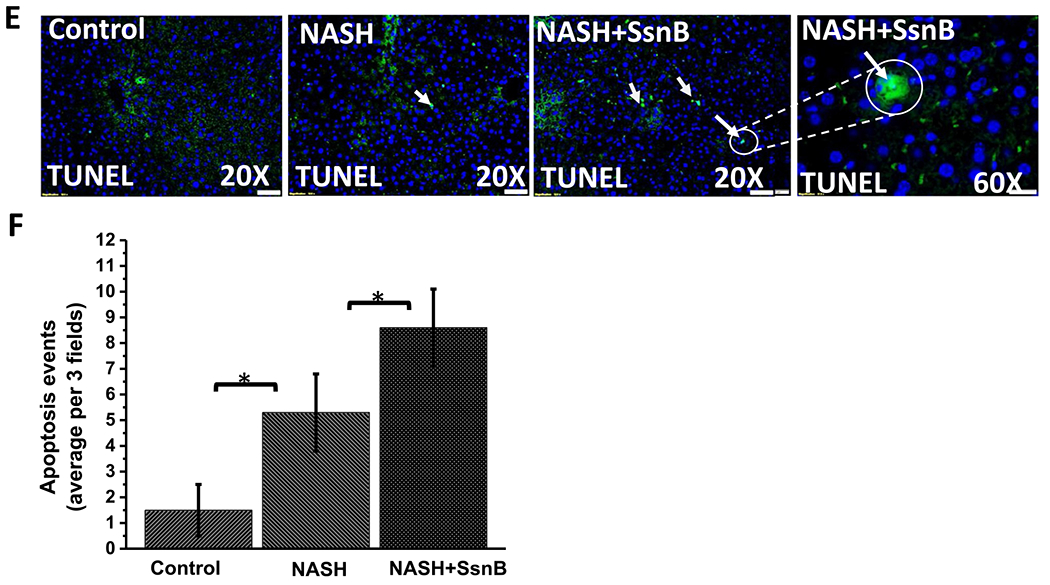
A. Cell cycle analysis of untreated cells (control), cells treated with LPS, LPS+SsnB10(10 μM), and LPS+SsnB100(100 μM). Quantitation of the PI staining data is presented as the cell cycle distribution percentages. B. Apoptosis is indicated by TUNEL based ApopTag® technology (EMD Millipore, MO) which labels 3’-OH ends of DNA fragments by fluorescent antibody as detected by immunofluorescence microscopy in Control (untreated), LPS-treated, and LPS+SsnB100 (100 μM) treated LX2 cells. C. Western blot analysis of p53, cleaved caspase3 (Casp3), total caspase3 (Casp3), cleaved PARP1 and β-actin protein levels of Control (untreated), LPS-treated, LPS+SsnB10 (10 μM), and LPS +SsnB100(100 μM) treated LX2 cells. D. Morphometric analysis of western blot where the bar diagram represents the level of p53, cleaved caspase3, total caspase3, cleaved PARP1 normalized against β-actin of respective samples. (*) P < 0.05 is considered statistically significant. E. TUNEL assay-based apoptosis analysis of Control, NASH, and NASH+SsnB treated mice liver samples. F. Morphometric analysis of apoptotic events/3 microscopic field. (*) P < 0.05 is considered statistically significant.