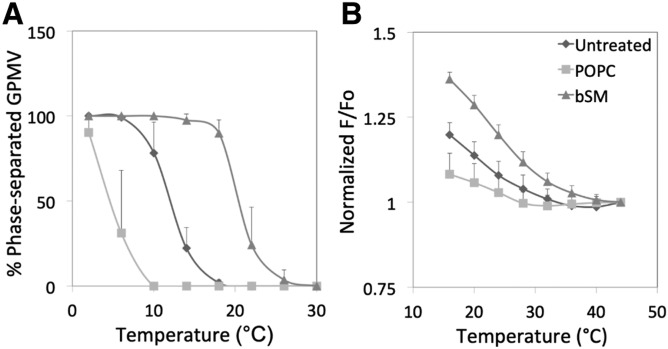
Fig. 2.
Effect of phospholipid exchange in cells upon phase separation and nanodomain formation in RBL-2H3 GPMVs. A: Phase separation assayed by fluorescence microscopy. B: Nanodomain formation assayed by FRET. F/Fo values are normalized to a value of 1 at the highest temperature at which measurements were made. Symbols: untreated (diamonds); after exchange with POPC (squares); after exchange with bSM (triangles). Samples prepared using 2 mM DTT and 24 mM PFA.

