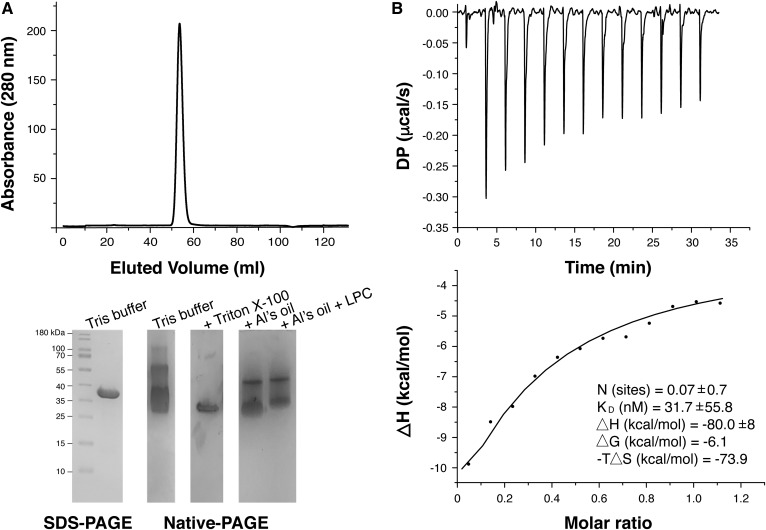
Fig. 5.
Charge states of CAlipase and binding assay. A: The size-exclusion chromatography of CAlipase and corresponding SDS-PAGE and native PAGE. The native PAGE shows broadened bands. Bands were reduced upon addition of Al’s Oil and Triton X-100. Addition of LPC in Al’s Oil induced further band reduction. B: ITC experiment of raw data and binding isotherms fitted to a one site binding model. The dissociation constant, ΔG, ΔH, and -TΔS are indicated in the figure.

