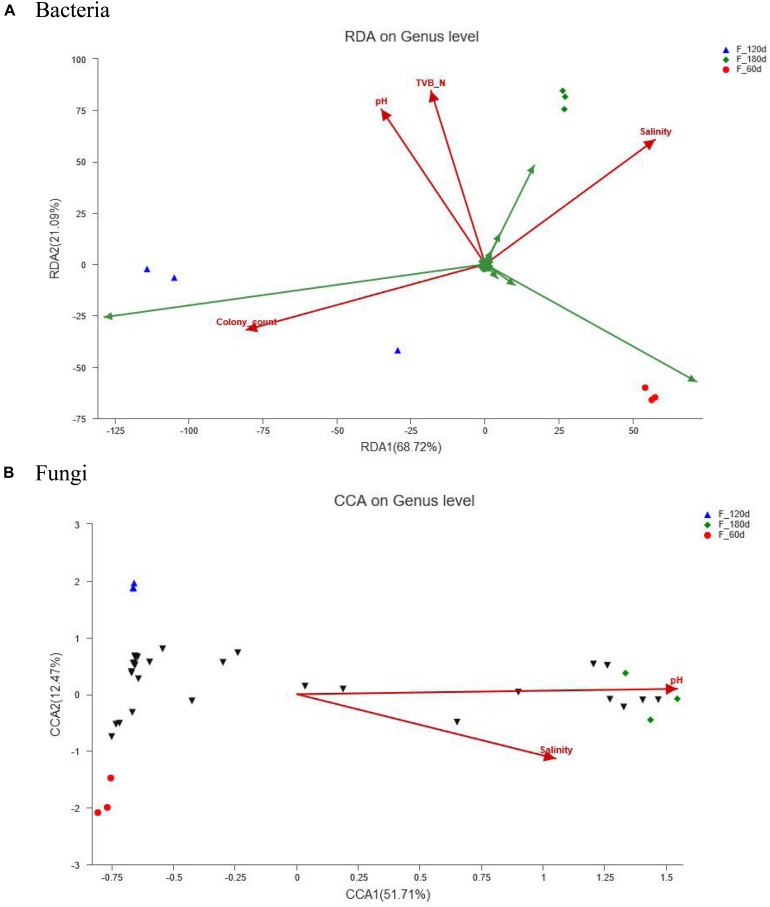
FIGURE 4.
RDA/CCA analysis of samples, microbial communities and physicochemical indexes: (A) Bacteria, (B) Fungi. Red arrows represent quantitative environmental factors, the length of which can represent the degree of impact of environmental factors on the distribution of species with the microbial communities; the angle represents correlation (acute angle: positive correlation, the smaller the angle, the greater the correlation; obtuse angle: negative correlation, the bigger the angle, the greater the correlation; right angle: no correlation).

