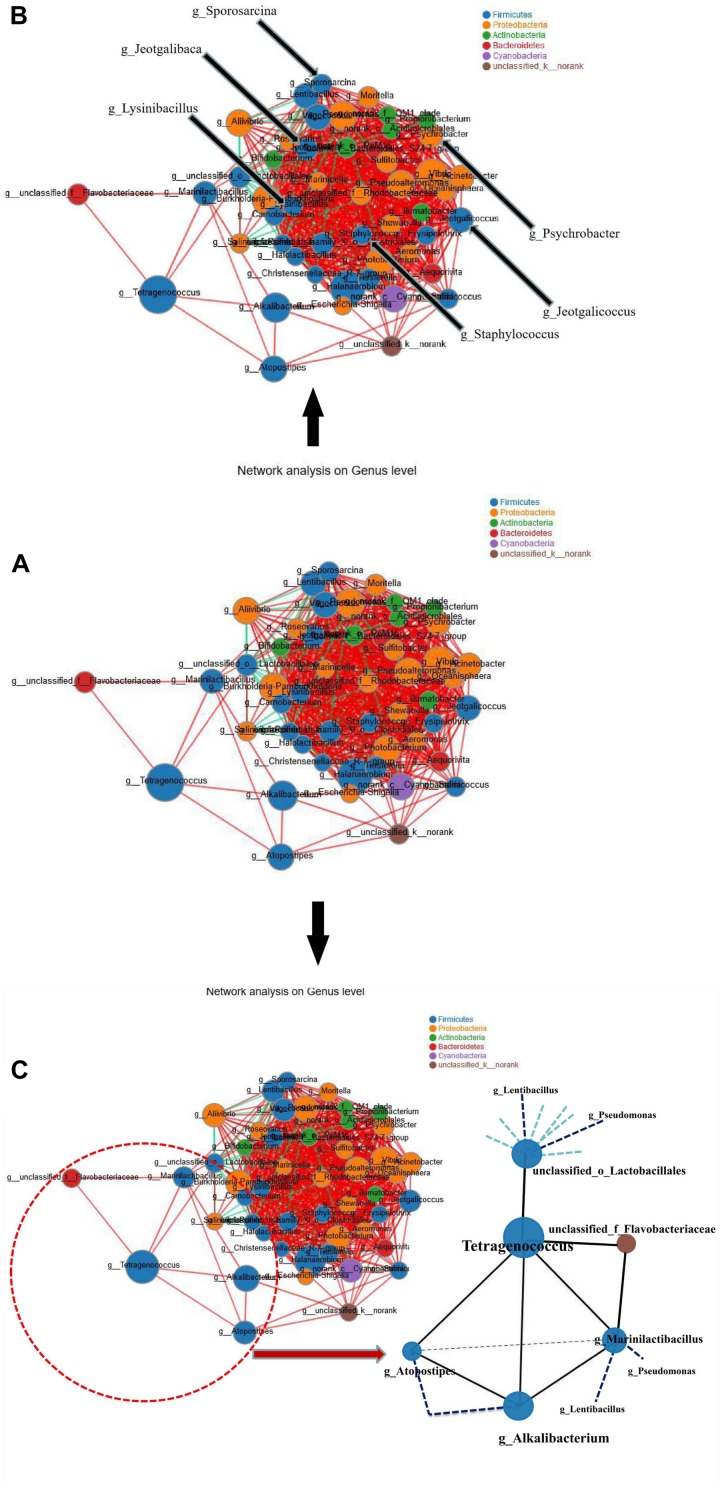
FIGURE 6.
Species relevance network map. (A) The interaction among the species in the shrimp paste samples. (B) The location of Jeotgalibaca, Jeotgalicoccus, Lysinibacillus, Sporosarcina, Staphylococcus and Psychrobacter. (C) The interaction between Tetragenococcus and its correlated genera. (The figure shows the species with p < 0.05, the absolute value of correlation coefficient ≥0.5; The size of nodes indicates the abundance of species, and different colors indicate different species. The red lines indicate positive correlation, while the green lines indicate negative correlation. The thicker the line, the higher the correlation between species, and the more lines, the closer the relationship between the species).

