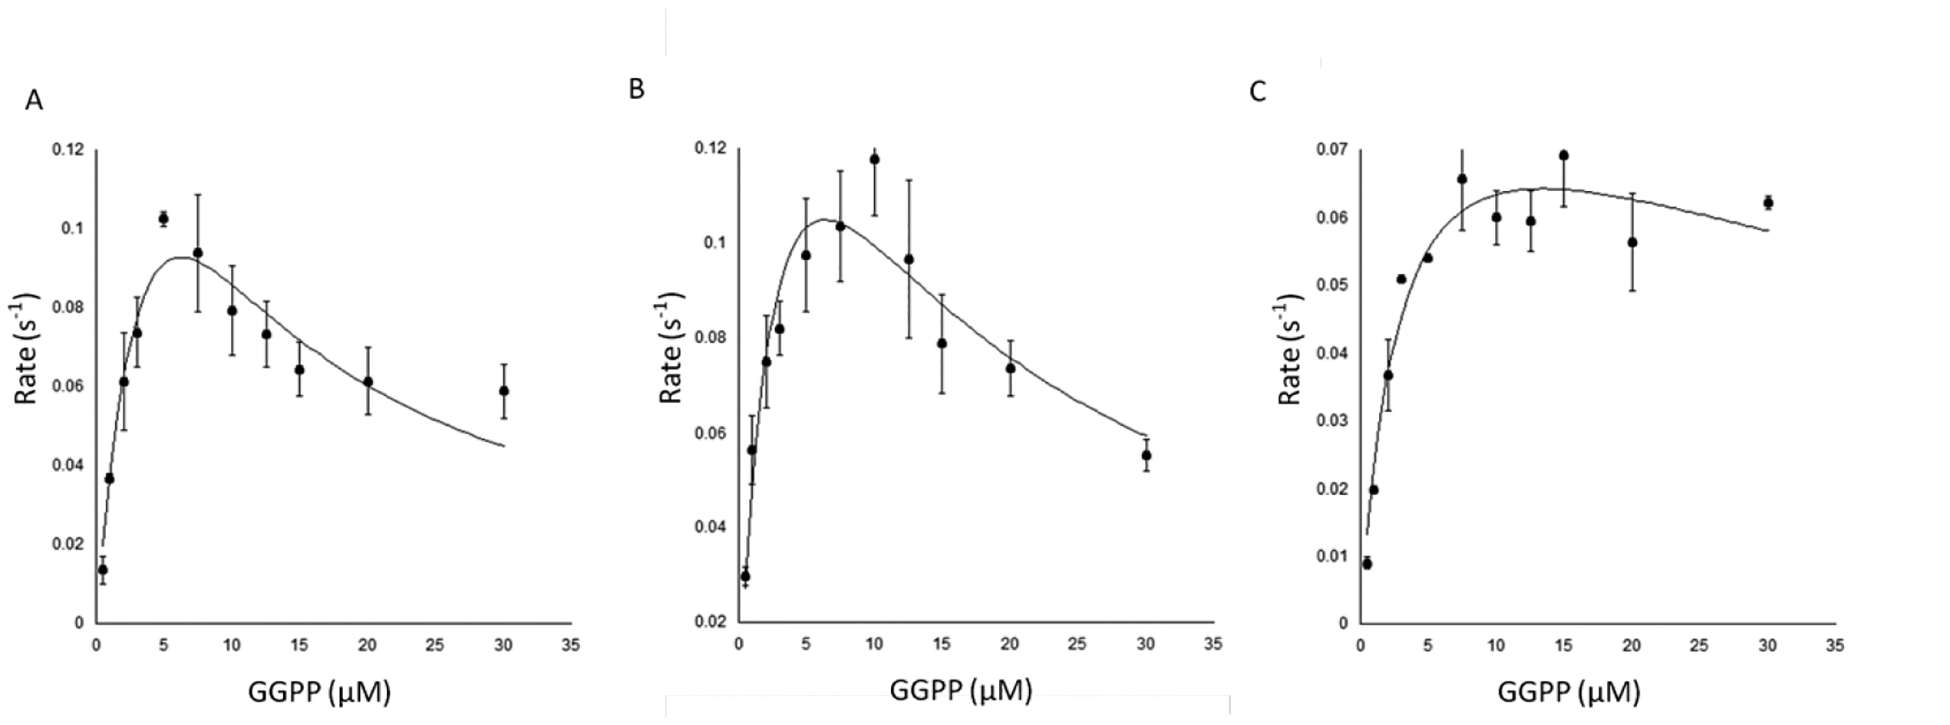
Extended Data Figure E9.

Effect of DPC on kinetic assays with AtCPS. Plot of observed reaction rate with varying concentrations of GGPP in the presence of A) 0 B) 10 or C) 100 μM DPC. Average from three independent measurements, error bars represent standard deviation. Line depicts fit to the substrate inhibition formula as previously described20.
