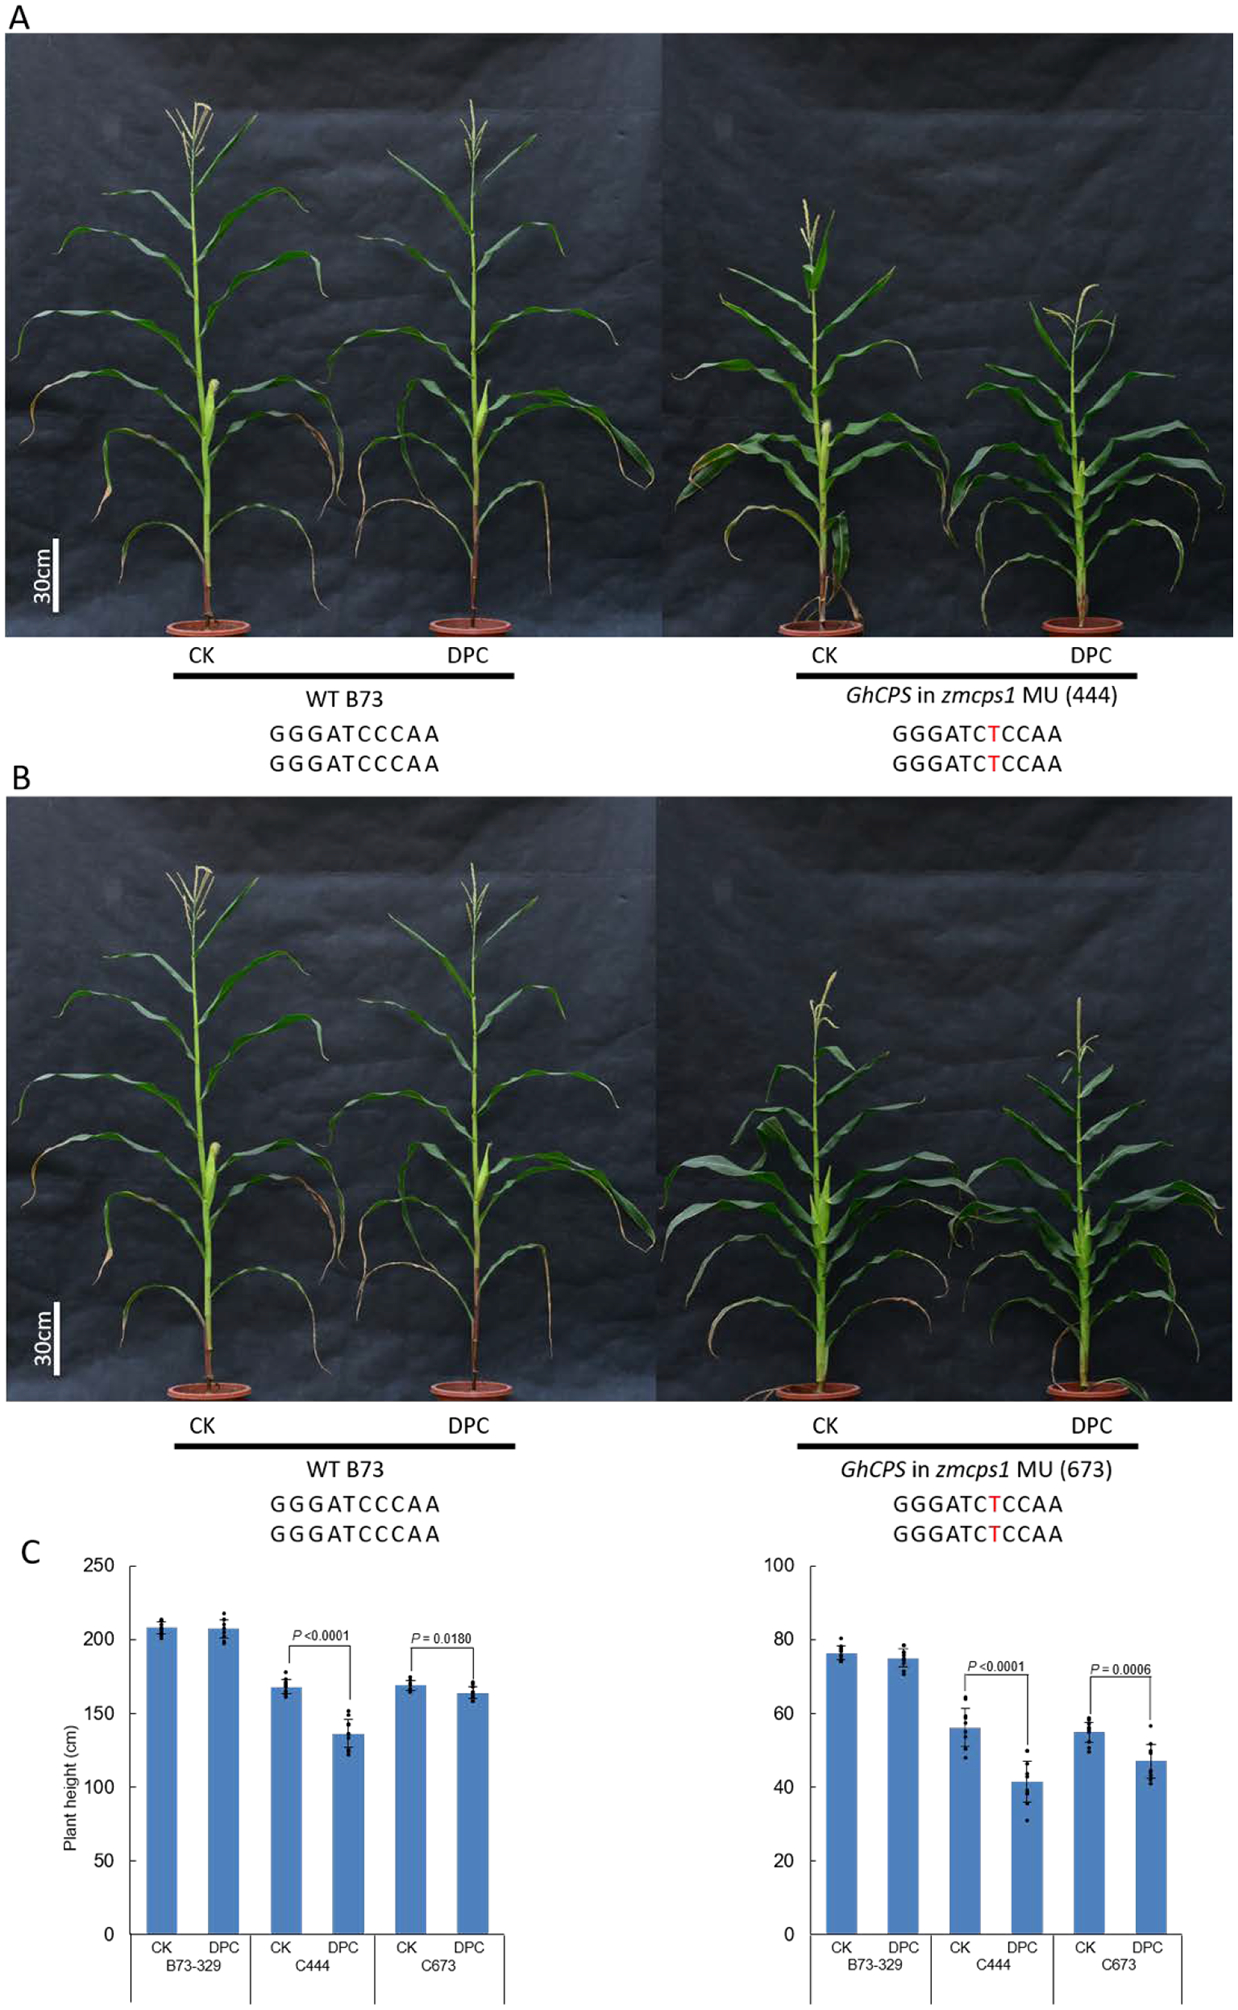
Extended Data Figure E4.

Effect of DPC on homozygous zmcps1/an1 transgenic maize, also expressing GhCPS. Pictured are A) GhCPS in zmcps1 MU (444); B) GhCPS in zmcps1 MU (673) plants to which DPC (500 mg/L) has been applied, as well as C) a histogram showing plant (Left) and ear (Right) height (n=10; means ± s.d., with significant differences (using two-sided Student’s t-test) indicated by shown P values, dots indicate values measured for individual plants).
