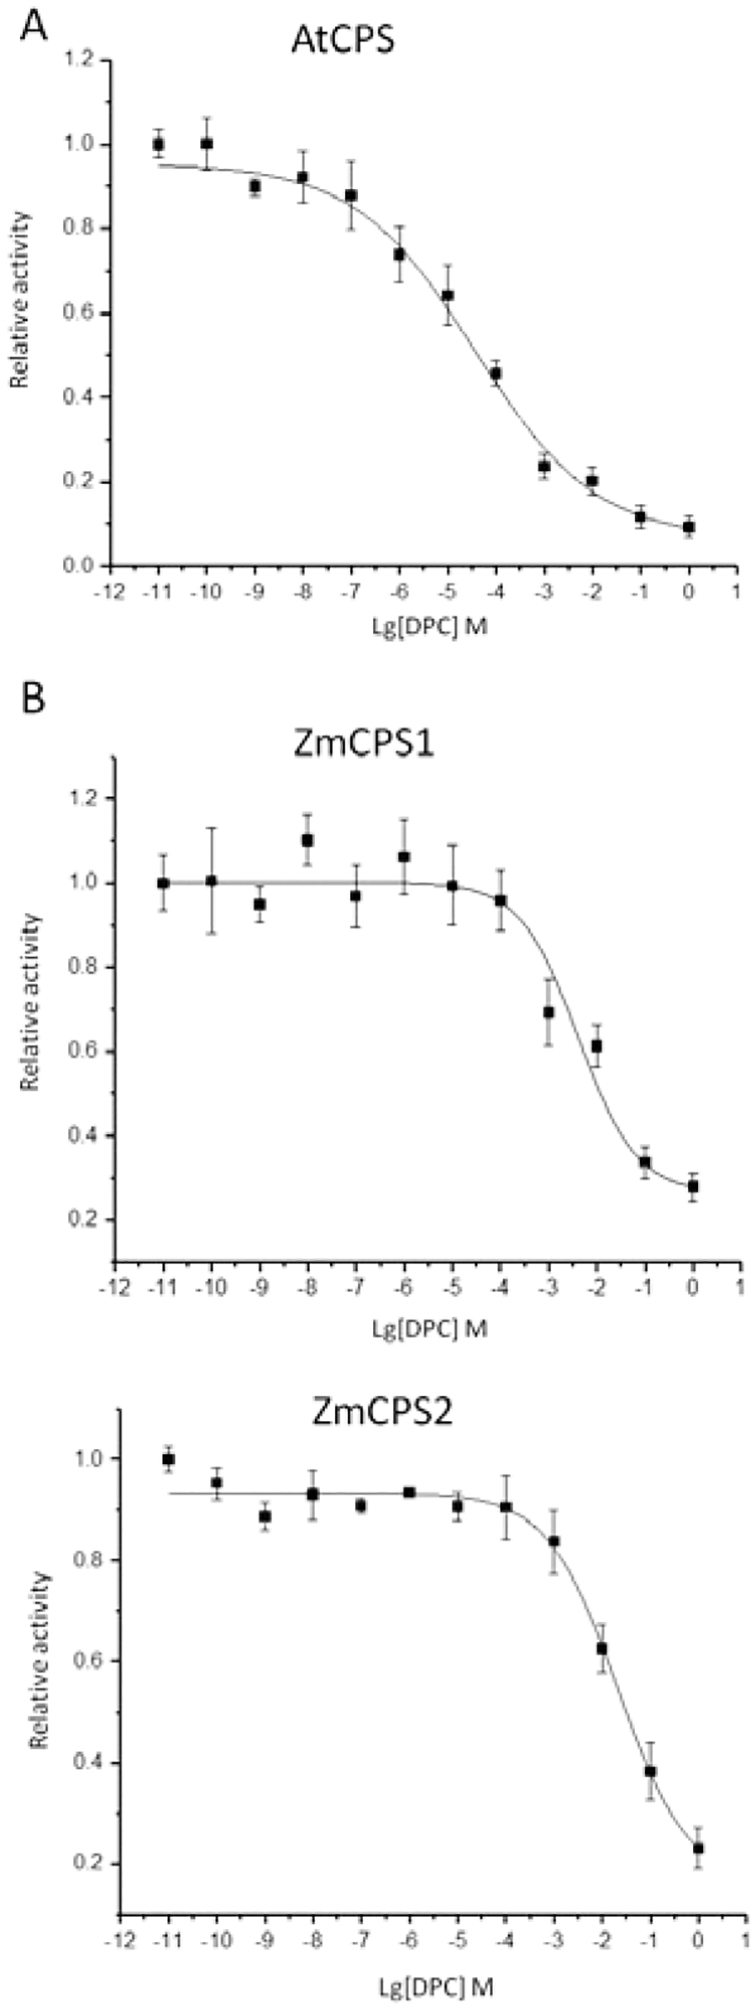
Extended Data Figure E7.

DPC is a selective CPS inhibitor. Effect of increasing DPC concentration on the activity of A) AtCPS; B) ZmCPS1; or C) ZmCPS2. Average from three independent measurements, error bars represent standard deviation. Lines indicate fit to y = A1 + (A2-A1)/(1 + 10^((LOGx0-x)*p)).
