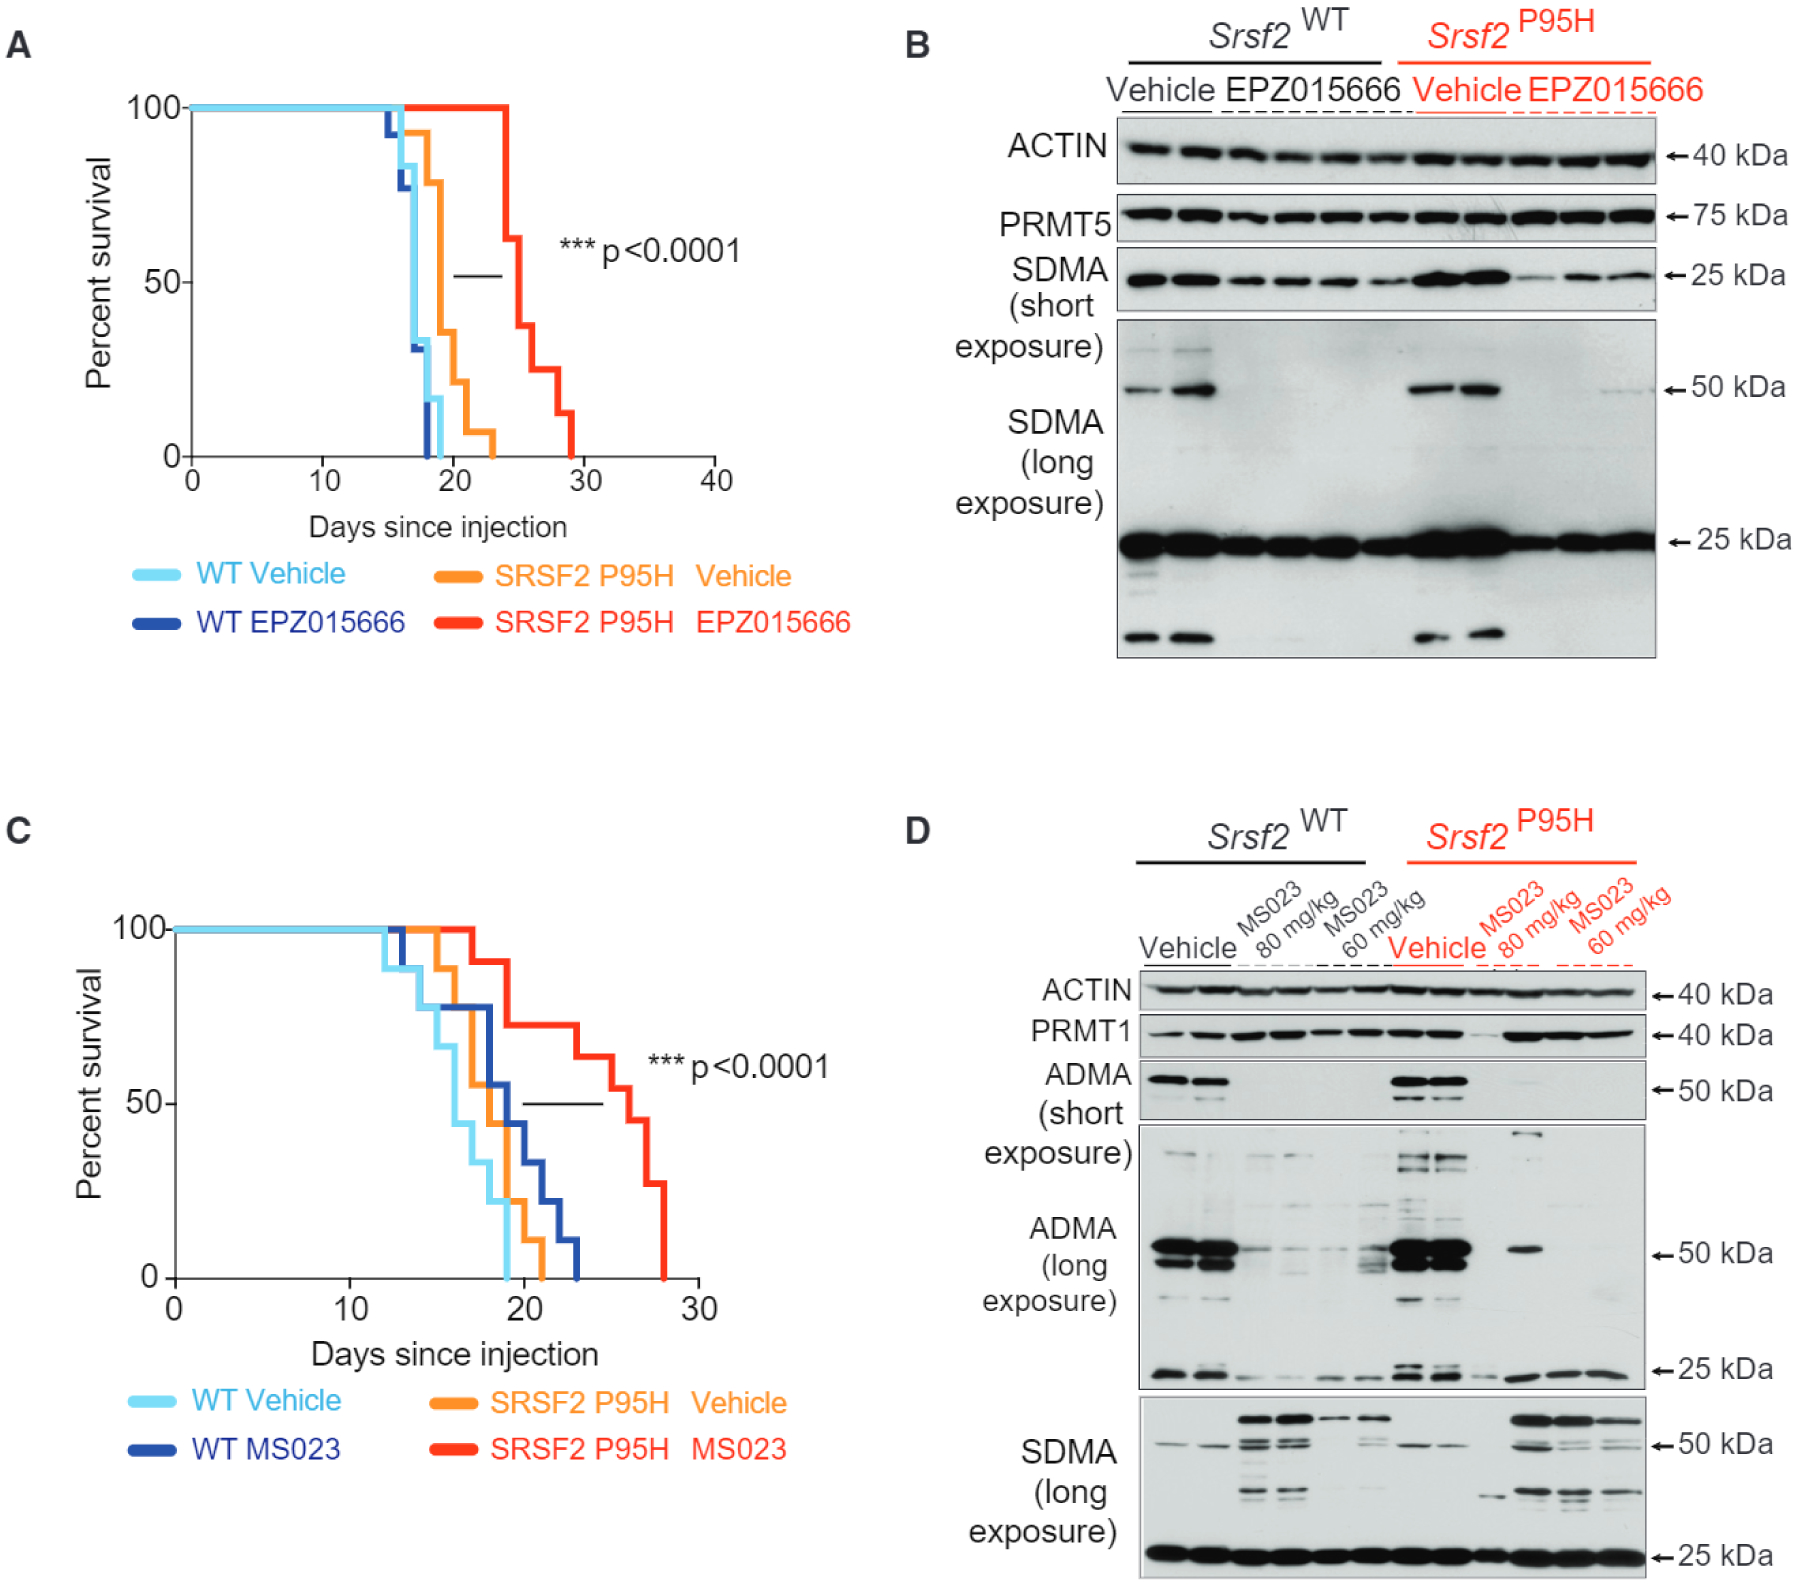
Figure 3. Preferential Effects of PRMT5 or Type I PRMT Inhibition on SF-Mutant AML over WT Counterparts In Vivo.

(A and B) Kaplan-Meier survival curve of mice treated with vehicle or EPZ015666. Survival comparison by Mantel-Cox log-ranked test (WT vehicle n = 12; WT drug n = 13, Srsf2P95H vehicle n = 14, Srsf2P95H drug n = 8) (A). Western blot of PRMT5, symmetric dimethyl arginine (SDMA; both a short exposure and a long exposure are shown), and actin in spleens of mice from (A) at time of death. Organs collected were 24 h after the last dose. Each column represents tissue from a distinct individual representative animal (B).
(C and D) Kaplan-Meier survival curve of mice treated with vehicle or MS023. Survival comparison by Mantel-Cox log-ranked test (WT vehicle n = 9, WT drug n = 9, Srsf2P95H vehicle n = 9, Srsf2P95H drug n = 11). (C) Western blot of PRMT1, asymmetric dimethylarginine (ADMA) (both a low exposure and a high exposure are shown), SDMA, and actin in spleens of mice from (C) at time of death. Organs collected were 24 h after the last dose. Each column represents tissue from a distinct individual representative animal (D). *p = 0.01–0.05, **p = 0.001–0.01, ***p = 0.0001–0.001, ****p < 0.0001.
See also Figure S2.
