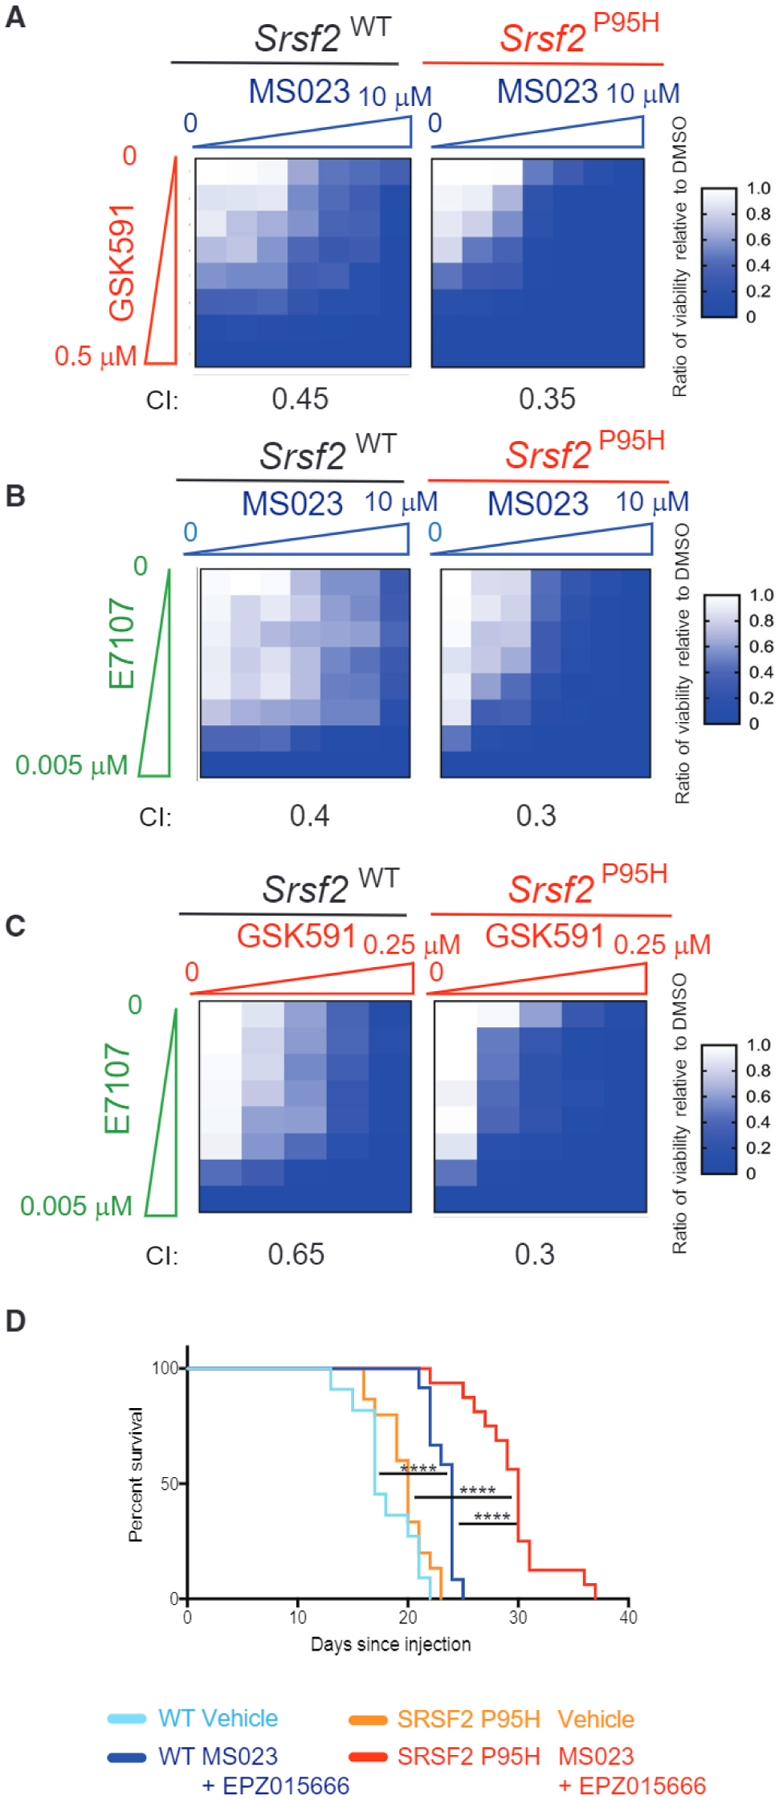
Figure 4. Synergistic Effects of Combined PRMT5, Type I PRMT, and/or SF3B Inhibition on Primary Mouse AMLs.

(A–C) Heatmap of half maximal inhibitory concentration values of WT or Srsf2P95H MLL-AF9 cells grown in increasing doses of MS023 plus GSK591 (A), MS023 plus E7107 (B), or GSK591 plus E7107 (C) for 7 days. The combination index (Cl) in each cell type for each drug pair is shown.
(D) Kaplan-Meier curve of mice transplanted with MLL-AF9 cells followed by combined treatment with MS023 plus EPZ015666 in vivo. Survival comparison by Mantel-Cox log-ranked test (WT vehicle n = 11, WT drug n = 12, Srsf2P95H vehicle n = 15, Srsf2P95H drug n = 16). *p = 0.01–0.05, **p = 0.001–0.01, ***p = 0.0001–0.001, ****p < 0.0001.
See also Figure S2.
