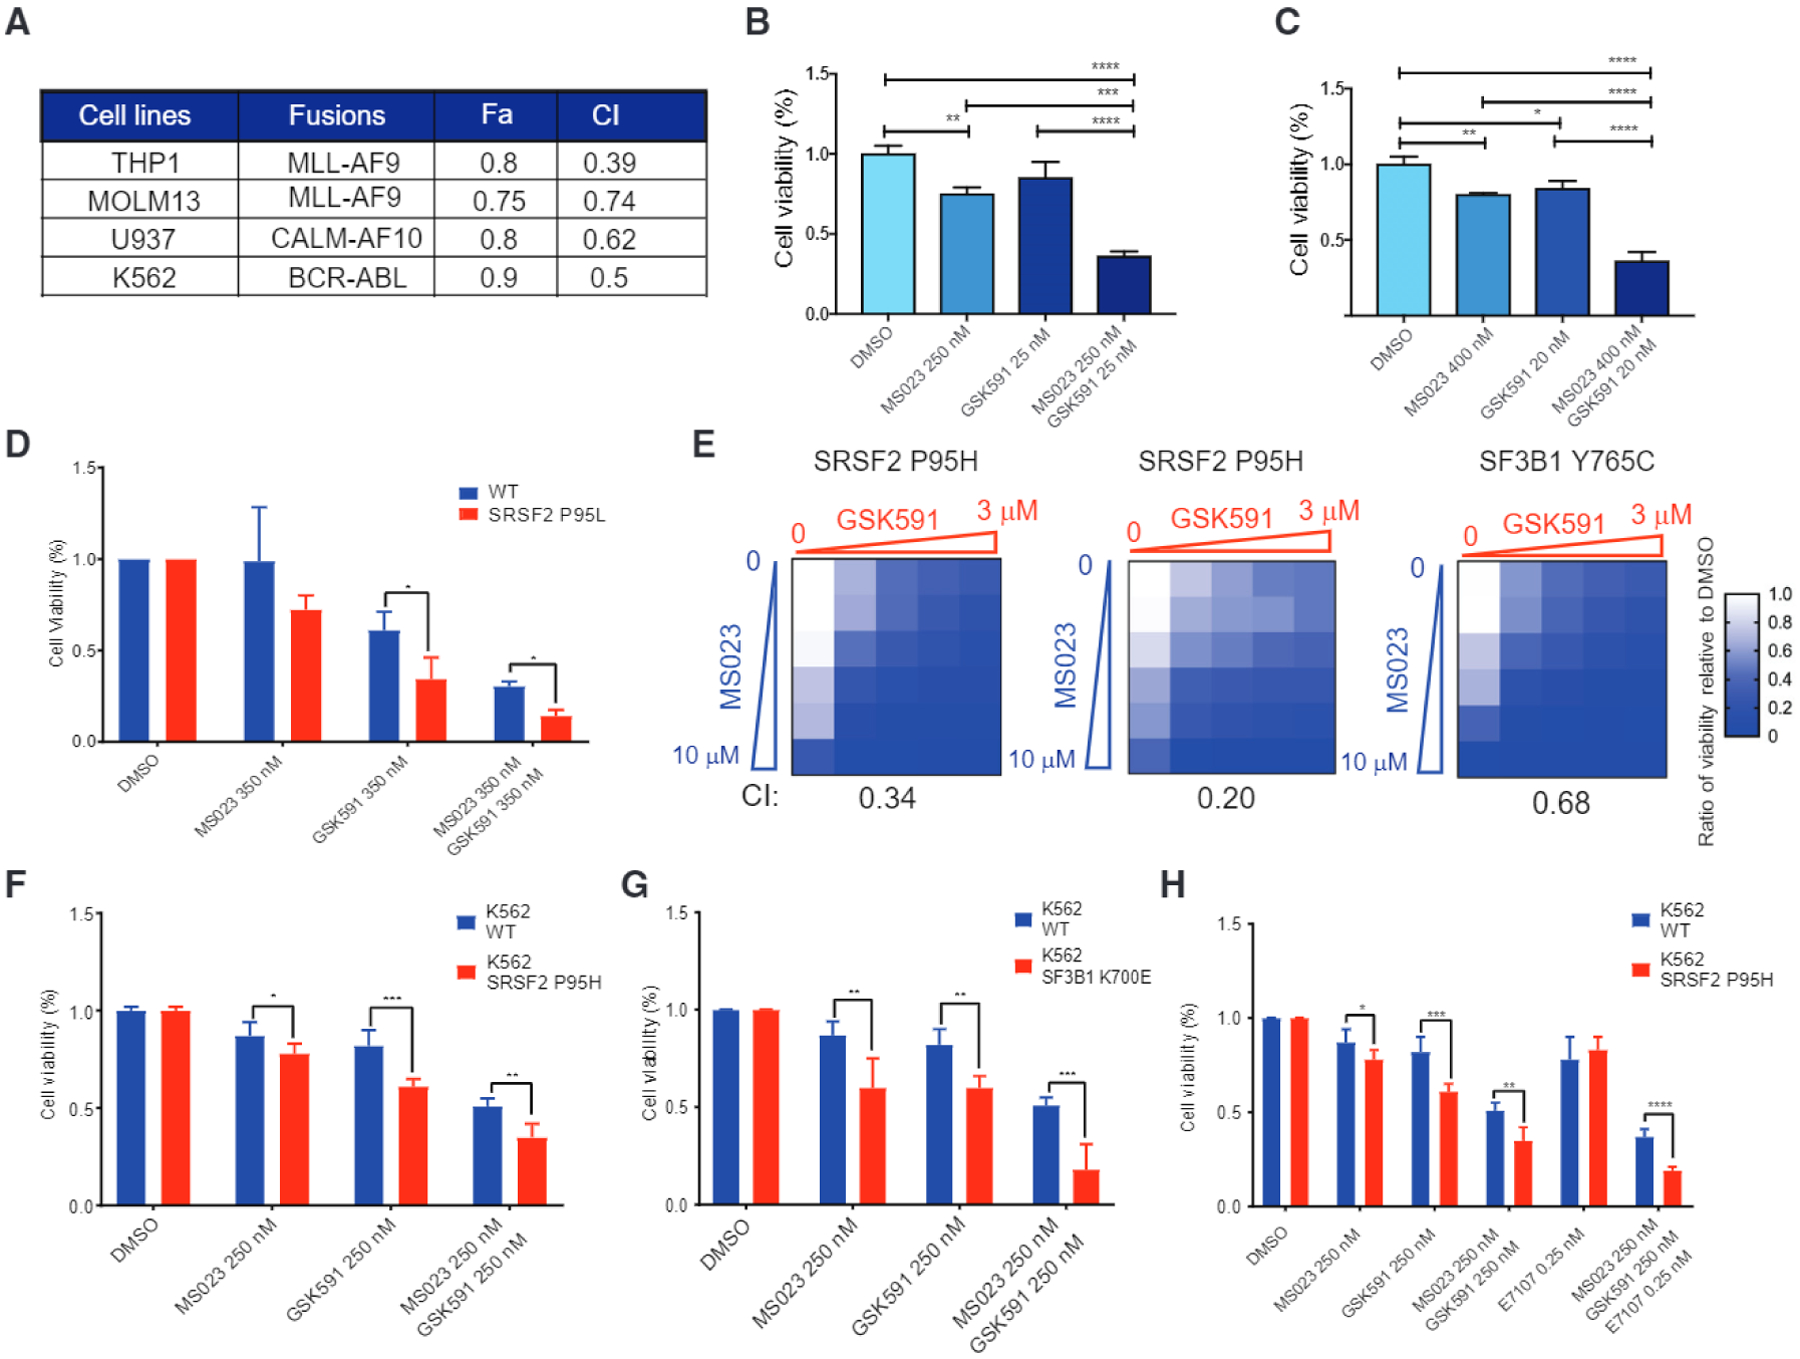
Figure 5. Synergistic Effects of Combined PRMT5, Type I PRMT, and/or SF3B Inhibition on Human AML Lines and Patient Samples.

(A) Summary of Cl and fraction affected (Fa) values of human AML cell lines treated with MS023 and GSK591.
(B and C) Percentage of viable THP1 (B) and U937 (C) cells after 8 days exposure to MS023, GSK591, or the combination relative to DMSO in vitro.
(D) Hematopoietic progenitor cells differentiated from the iPSC lines 5–16 Cre20 (SRSF2 P95L) and N-2.12 (isogenic normal) were treated as indicated. Cell viability represents cell counts relative to DMSO-treated cells.
(E) Heatmap of cell viability after 6 days of treatment. Cl at IC50 values of MS023 plus GSK591 is indicated at the bottom.
(F and G) Percentage of viable K562 WT or SRSF2P95H knockin mutant cells (F) and K562 WT or SF3B1K700E knockin mutant cells (G) after 8 days treatment with MS023, GSK591, or the combination relative to DMSO in vitro.
(H) Percentage of viable K562 WT or SRSF2P95H knockin mutant cells after 8 days treatment with MS023, GSK591, E7107 or in combination relative to DMSO in vitro.
All data are representative of three independent experiments, error bars represent SD. *p = 0.01–0.05, **P = 0.001–0.01, ***P = 0.0001–0.001, ****p < 0.0001; one-way ANOVA was used to analyze THP1 and U937, while unpaired t test was used for K562 WT and SRSF2P95H. See also Figures S3 and S4.
