Figure 6.
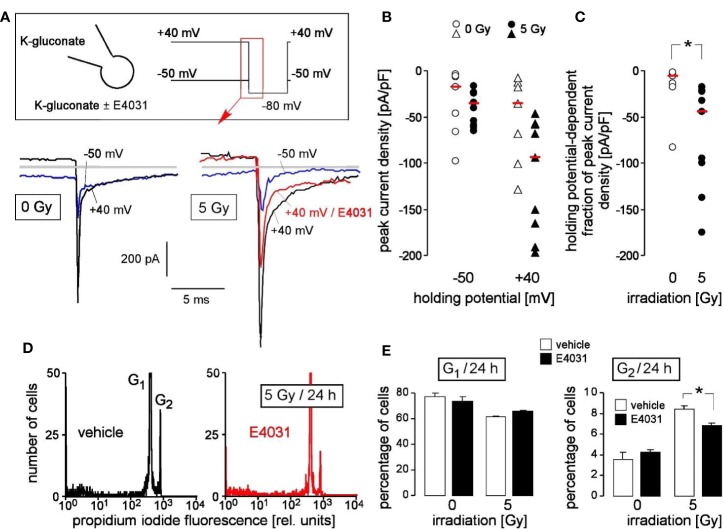
Primary chronic myeloid leukemia (primary CML) cells express radiation-induced hERG currents: involvement in G2/M cell cycle arrest. (A) Whole-cell deactivating tail current tracings from a control (0 Gy, left) and an irradiated primary CML cell (5 Gy, right). Records were obtained with K-D-gluconate pipette and Na-D-gluconate bath solution (insert). Square pulses to −80 mV (insert) were either delivered from a holding potential of +40 mV (black tracings) or −50 mV (blue tracings) as indicated. The current tracing in red color was recorded during administration of E4031 (3 µM). Gray lines indicate zero current. (B, C) Peak current densities of the deactivating tail current after stepping the clamp voltage to −80 mV either from a holding potential of −50 or +40 mV (B) and holding potential-dependent peak current density fractions of the deactivating tail current (C) of control (0 Gy, open symbols) or 5 Gy-irradiated primary (closed symbols) CML cells. Symbols and red lines indicate individual values (n = 7–9) and medians, respectively. (D) Flow cytometry histograms showing the propidium iodide fluorescence (Nicoletti staining) of primary CML cells that were irradiated (5 Gy) and post-incubated (24 h) with vehicle (left) or hERG inhibitor E4031 (3 µM, right). (E) Mean (± SE, n = 3–4) percentage of irradiated (0 or 5 Gy) primary CML cells residing 24 h after irradiation in G1 (left) or G2 (right) phase of cell cycle (right). Cells were pre- and post-incubated with vehicle (open bars) or E4031 (3 µM, closed bars). * indicates p ≤ 0.05, two-tailed (Welch-corrected) t-test in (C) and ANOVA in (E).

