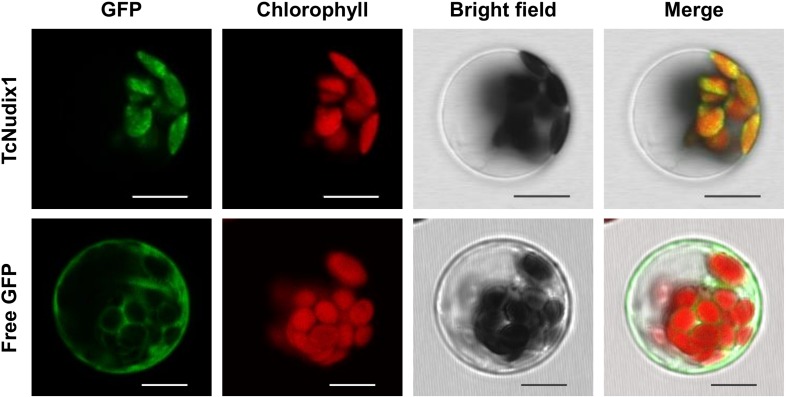
FIGURE 3.
Representative results showing subcellular localization of TcNudix1. Images from left to right are: green fluorescence from GFP, autofluorescence from chloroplasts, bright field under visible light, and overlay of those three images. Images for the same gene are of the same cell. Unfused GFP construct was used as control. Scale bars = 10 μm.

