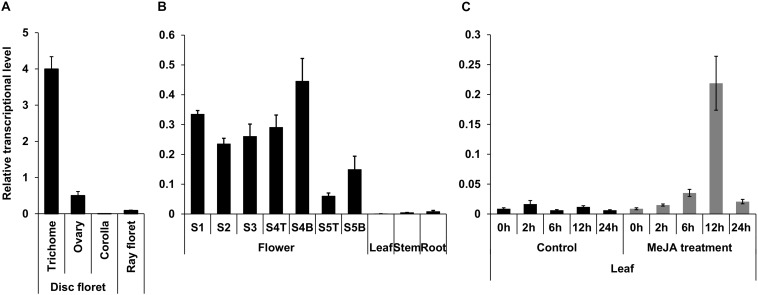
FIGURE 4.
Tissue specific expression of TcNudix1. (A) RT-qPCR analysis of TcNudix1 transcript levels in different parts of stage-3 flowers. (B) RT-qPCR analysis of TcNudix1 transcript levels in different developmental stages of flowers, leaf, stem and root (“T”: ray floret, “B”: disk florets). (C) RT-qPCR analysis of 2-week-old leaves treated with MeJA. (Data are presented as means ± SD, n = 3 or 4).

