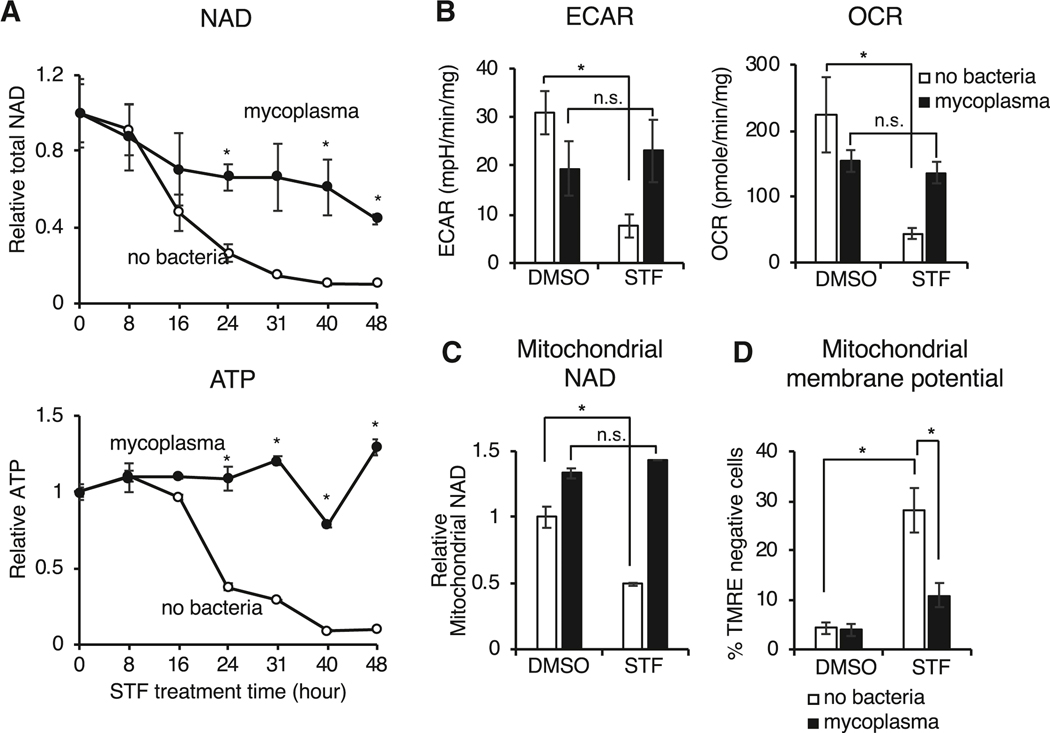
Figure 2. Mycoplasma infection confers host cells resistance to NAMPT inhibitors by preventing NAD depletion.
(A) Mycoplasma prevent NAMPTi-induced NAD and ATP depletion. Total cellular NAD (NADH + NAD+) and ATP levels were measured in uninfected (no bacteria) or mycoplasma-infected CRC119 cells treated with 100 nM STF118804 (STF) (n=3, values are normalized to the corresponding time zero controls and expressed as mean ±SD, *p<0.05).
(B) Mycoplasma prevent NAMPTi-induced inhibition of glycolysis (ECAR) and oxidative phosphorylation (OCR). Uninfected clean or mycoplasma-infected CRC119 cells were treated with 100 nM STF118804 (STF) for 48 hours. The basal extracellular acidification rate (ECAR) and oxygen consumption rate (OCR) were measured using Seahorse instrument (n=7–8, values are expressed as mean ±SD, *p<0.05).
(C) Mycoplasma prevent NAMPTi-induced mitochondrial NAD depletion. Relative levels of mitochondrial total NAD were measured after 24 hours treatment with 100 nM STF118804 (STF) or DMSO control (n=3, values are normalized to the uninfected DMSO control and expressed as mean ±SD, *p<0.05).
(D) Mycoplasma prevent NAMPTi-induced loss of mitochondrial membrane potential. Mitochondrial membrane potential loss (% TMRE-negative cells) was measured by flow cytometry after 24 hours treatment with 100 nM STF118804 (STF) or DMSO control. (n=3, values are expressed as mean ±SD, *p<0.05).
See also Figure S2C.

