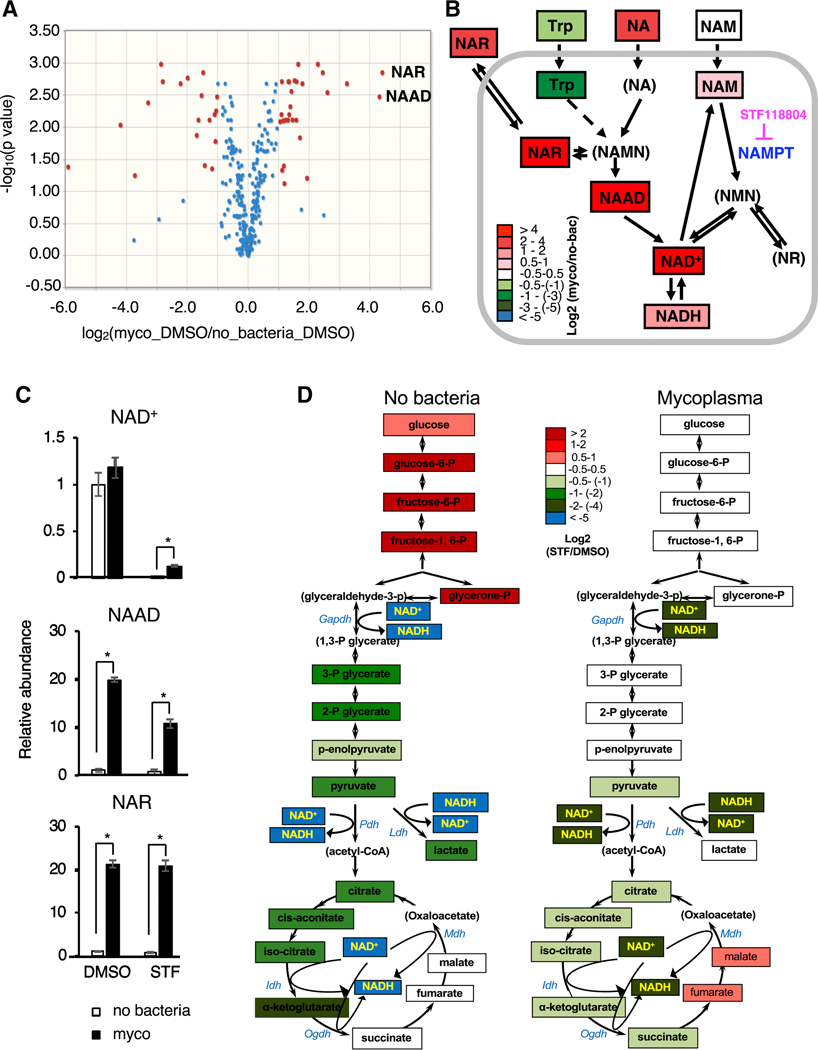
Figure 3. Mycoplasma induce deamidated NAD precursors and prevent NAMPTi-induced NAD and energy depletion.
(A) Mycoplasma increase cellular levels of deamidated NAD precursors. Clean (no bacteria) or M. hyorhinis-infected (myco) CRC119 cells were treated with either 100 nM STF118804 or with DMSO control for 24 hours and relative levels of 330 metabolites were determined by LC-MS. Volcano plot of metabolites from mycoplasma-infected cells (Myco_DMSO) vs. uninfected cells (no bacteria_DMSO).
(B) Mycoplasma increase deamidated NAD precursors inside the cells and in the medium upon STF118804 treatment. The log ratios of the relative abundance of metabolites in clean and infected cells are represented by color scale. Metabolites in parenthesis were not detected in our LC-MS analysis.
(C) Relative levels of NAD+ and the top differential metabolites (NAAD and NAR) (n=3, values are normalized to the uninfected DMSO control and expressed as mean ±SD, *p<0.05).
(D) Mycoplasma prevent NAMPTi-induced inhibition of energy metabolism. Relative changes in the levels of glycolysis and TCA cycle metabolites following STF18804 treatment are shown for uninfected (left panel) and mycoplasma-infected cells (right panel). The log ratios of the relative abundance of metabolites in indicated pathways in clean and infected cells are represented by color scale. Metabolites in parenthesis were not detected in our LC-MS analysis (n=3, values are expressed as mean ±SD). See also Table S3 for the complete metabolomics data. See also Figure S3.

