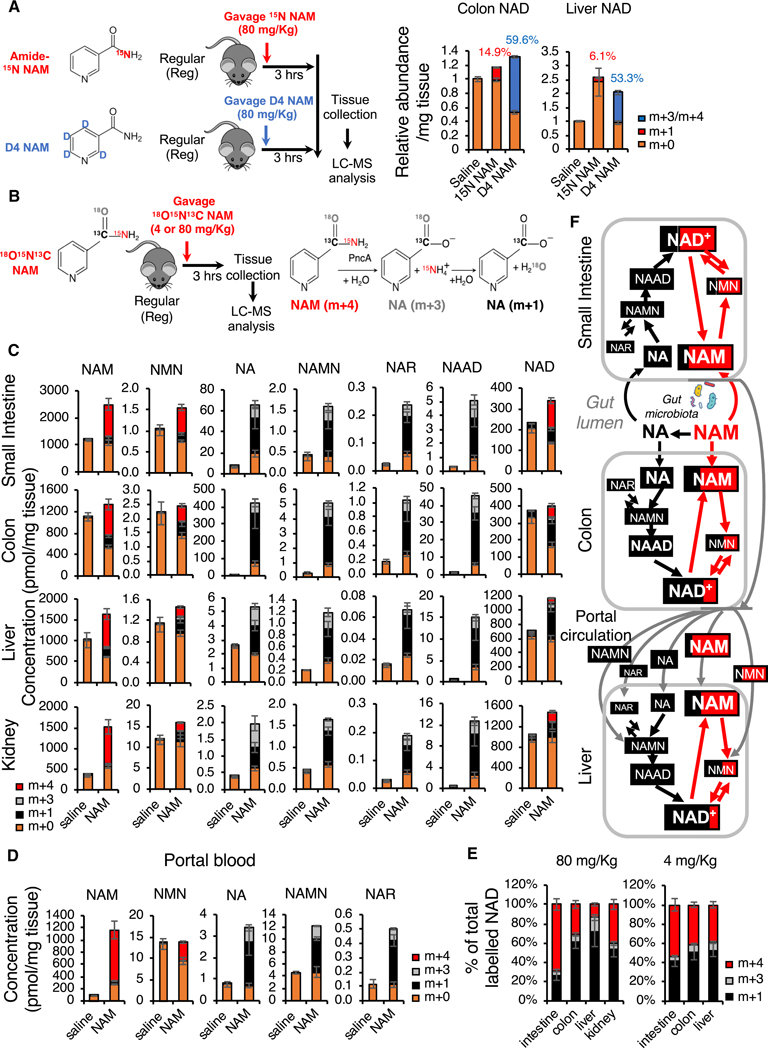
Figure 6. Oral NAM is incorporated into NAD primarily through gut microbiota-enabled deamidated NAD biosynthesis pathway in several mouse tissues.
(A) Dietary NAM is incorporated into colon and hepatic NAD primarily through the deamidated pathway in regular mice. Microbiota-proficient regular mice (Reg) were gavaged with control saline, 80 mg/Kg amide-15N labeled NAM (15N NAM), or 80 mg/Kg D4 NAM, then dissected three hours later. Relative abundance of unlabeled (m+0), and 15N labeled (m+1), or D4/D3 labeled (m+3/m+4) in colons and livers of indicated mice were measured by LC-MS (n=4 mice/group, values are expressed as mean ±SEM).
(B) Schematic of the [18O,15N,13C-amide]nicotinamide (18O,15N,13C-NAM) gavage experiment. The right panel shows the PncA-mediated reactions that lead to the indicated molecular weight changes.
(C) Oral NAM is incorporated into NAD primarily through the deamidated NAD salvage pathway in colon, liver, and kidney. Regular mice were gavaged with either saline or 80 mg/Kg 18O,15N,13C-NAM. The concentrations of unlabeled (m+0) and labeled NAD pathway metabolites synthesized via the deamidated (m+3 and m+1), and amidated (m+4) pathways in indicated tissues were measured by LC-MS 3 hours after gavage (n=3–4 mice/group, values are expressed as mean ±SEM).
(D) NAMN is the major deamidated NAM precursor in the portal blood. Concentrations of the indicated NAD pathway metabolites in blood collected from the portal vein in the experiment described in (B), (C) (n=3 mice/group, values are expressed as mean ±SEM).
(E) Oral NAM supplement is incorporated into NAD primarily through gut microbiota-enabled deamidated NAD salvage in several mouse tissues. Data from the experiment in (B) is presented as a percentage of labeled NAD synthesized via the deamidated (m+3 and m+1) and amidated (m+4) pathways for both 4 mg/Kg and 80 mg/Kg doses of 18O,15N,13C-NAM (n=3–4 mice/group).
(F) The relative fractions of the labeled NAD metabolites synthesized via the amidated pathway (Red, m+4) or via the deamidated pathway (Black, m+1 and m+3) after oral gavage of 80 mg/Kg of 18O,15N,13C-NAM are graphed proportionally based on the data in (C, D). The font size of each metabolite is roughly proportional to its tissue concentration. Gut lumen content was not analyzed in this experiment and is presented here schematically based on data from a similar experiment presented on Figure 5B.
See also Figures S5D–S5G.

