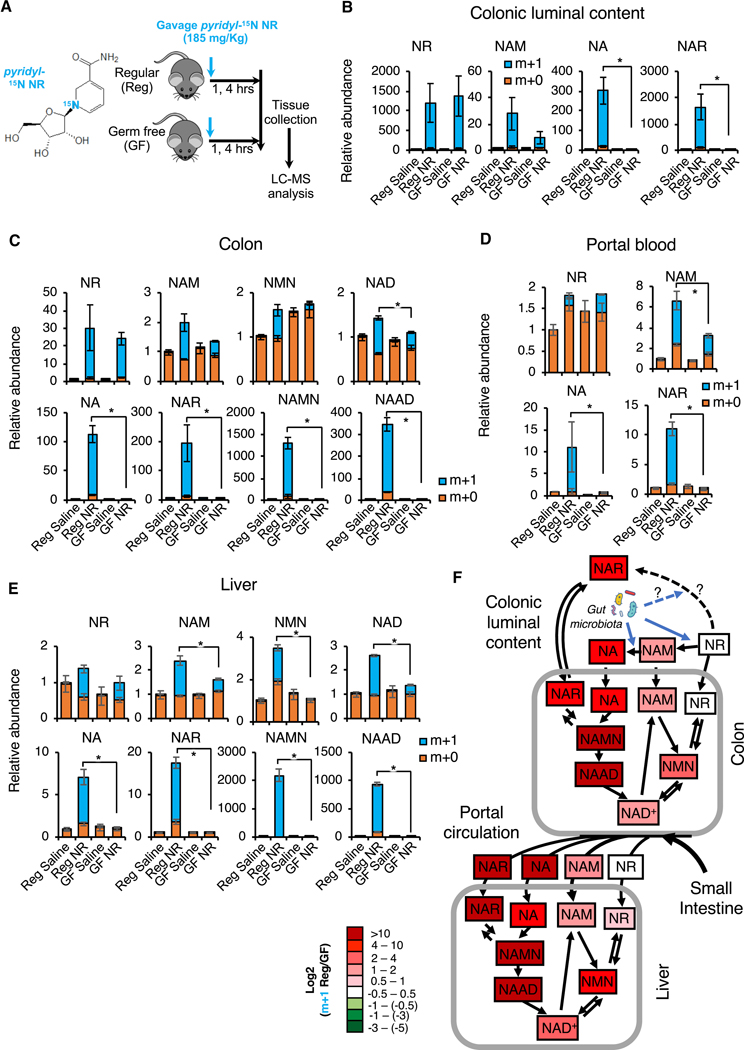
Figure 7. Gut microbiota plays an important role in incorporation of dietary NR into deamidated precursors and NAD in vivo.
(A) Schematic of the experiment. Regular (Reg) and germ-free (GF) C57BL/6NTac mice were gavaged with 185 mg/kg of pyridyl-15N-labeled NR chloride or with saline control, and dissected one or four hours later.
(B) Gut microbiota converts NR into NAM, NA, and NAR in the colonic lumen. Relative abundance of unlabeled (m+0) and labeled (m+1) NR, NAM, and NA in the colonic lumen content of indicated mice were measured by LC-MS four hours after NR gavage (n=3–4 mice/group, values are expressed as mean ±SEM, *p<0.05).
(C) Gut microbiota is important to incorporate dietary NR into metabolites in both amidated and deamidated NAD biosynthesis pathways and into NAD in colons. Relative abundance of unlabeled (m+0) and labeled (m+1) NAD pathway metabolites in colons were measured by LC-MS 4 hours after NR gavage (n=3–4 mice/group, values are expressed as mean ±SEM, *p<0.05).
(D) Gut microbiota-produced amidated and deamidated NAD precursors from dietary NR are detectable in the portal blood. Relative abundance of unlabeled (m+0) and labeled (m+1) NAD pathway metabolites in the portal blood were measured by LC-MS four hours after NR gavage (n=3–4 mice/group, values are expressed as mean ±SEM, *p<0.05).
(E) Gut microbiota is important to incorporate dietary NR into hepatic NAD through both amidated and deamidated pathways. Relative abundance of unlabeled (m+0) and labeled (m+1) hepatic metabolites in NAD metabolic pathways were measured by LC-MS 4 hours after NR gavage (n=3–4 mice/group, values are expressed as mean ±SEM, *p<0.05).
(F) Gut microbiota boosts the flux of dietary NR into NAD through both amidated and deamidated pathway in vivo. The log ratios of the relative abundance of indicated labeled metabolites are represented by a color scale (n=3–4 mice/group).
See also Figures S6 and S7.

