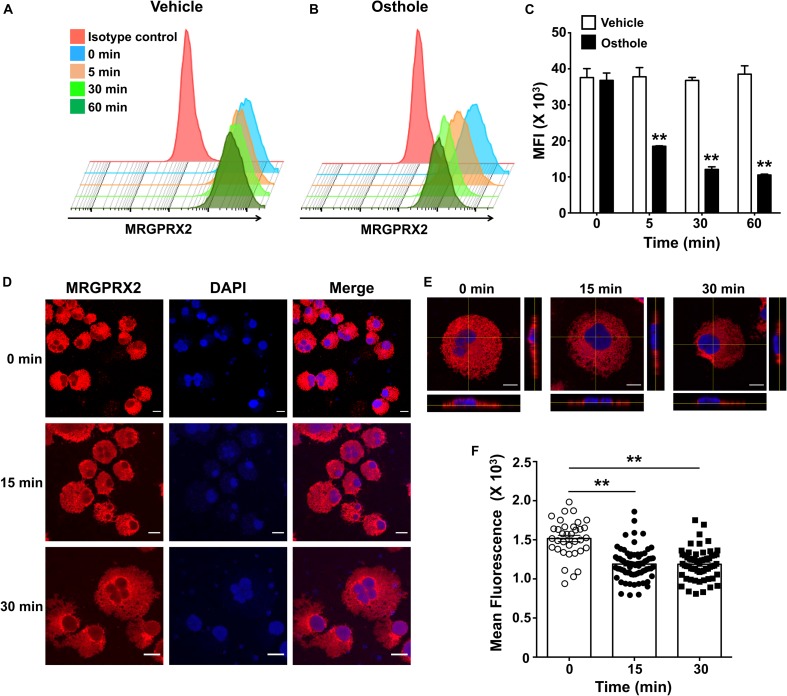
FIGURE 8.
Osthole decreases the expression of MRGPRX2 in LAD2 mast cells. LAD2 cells were exposed to (A) vehicle or (B) osthole (72 μM) for the indicated time points, washed, stained with PE conjugated MRGPRX2 antibody and analyzed by flow cytometry. Representative histograms of MRGPRX2 surface expression at different time points after vehicle or osthole exposure are shown. (C) Bar graph shows the mean fluorescence intensity (MFI) of MRGPRX2 receptor expression following vehicle or osthole treatment. Data are mean ± SE from three experiments. Statistical significance was determined by unpaired Student’s t-test comparing the vehicle vs. osthole treated groups *p < 0.05 and **p < 0.01. (D) Immunofluorescence staining of MRGPRX2 was performed in LAD2 cells treated with osthole (72 μM) for different time intervals. Representative images of MRGPRX2 expression (red) and nucleus (DAPI) are shown. Scale bar = 10 μm. (E) Z-stack confocal microscopy images with cross-sectional views taken at 100 x magnification show localization of MRGPRX2 (red) after osthole exposure. (F) Bar graph shows mean fluorescence intensities corresponding to MRGPRX2 expression in LAD2 cells obtained from the confocal experiments. Data represent mean ± SE from three experiments with 30–70 cells analyzed in each group. Statistical analysis was done using unpaired t-test **p < 0.01.

