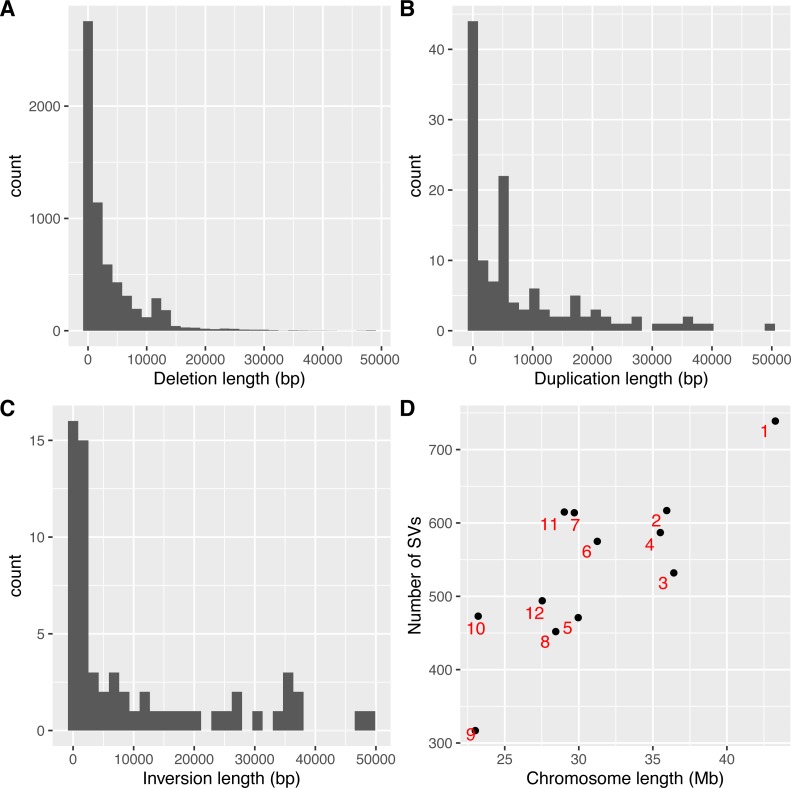
Figure 3. Lengths and genome distributions of SVs identified by intansv using the dataset of Zhenshan 97.
(A) Histogram of the lengths of deletions identified by intansv. (B) Histogram of the lengths of duplications identified by intansv. (C) Histogram of the lengths of inversions identified by intansv. (D) Comparison of the size of each chromosome with the number of SVs identified in each chromosome. Each chromosome is represented as a black point with the identifier labeled beside the corresponding point.

