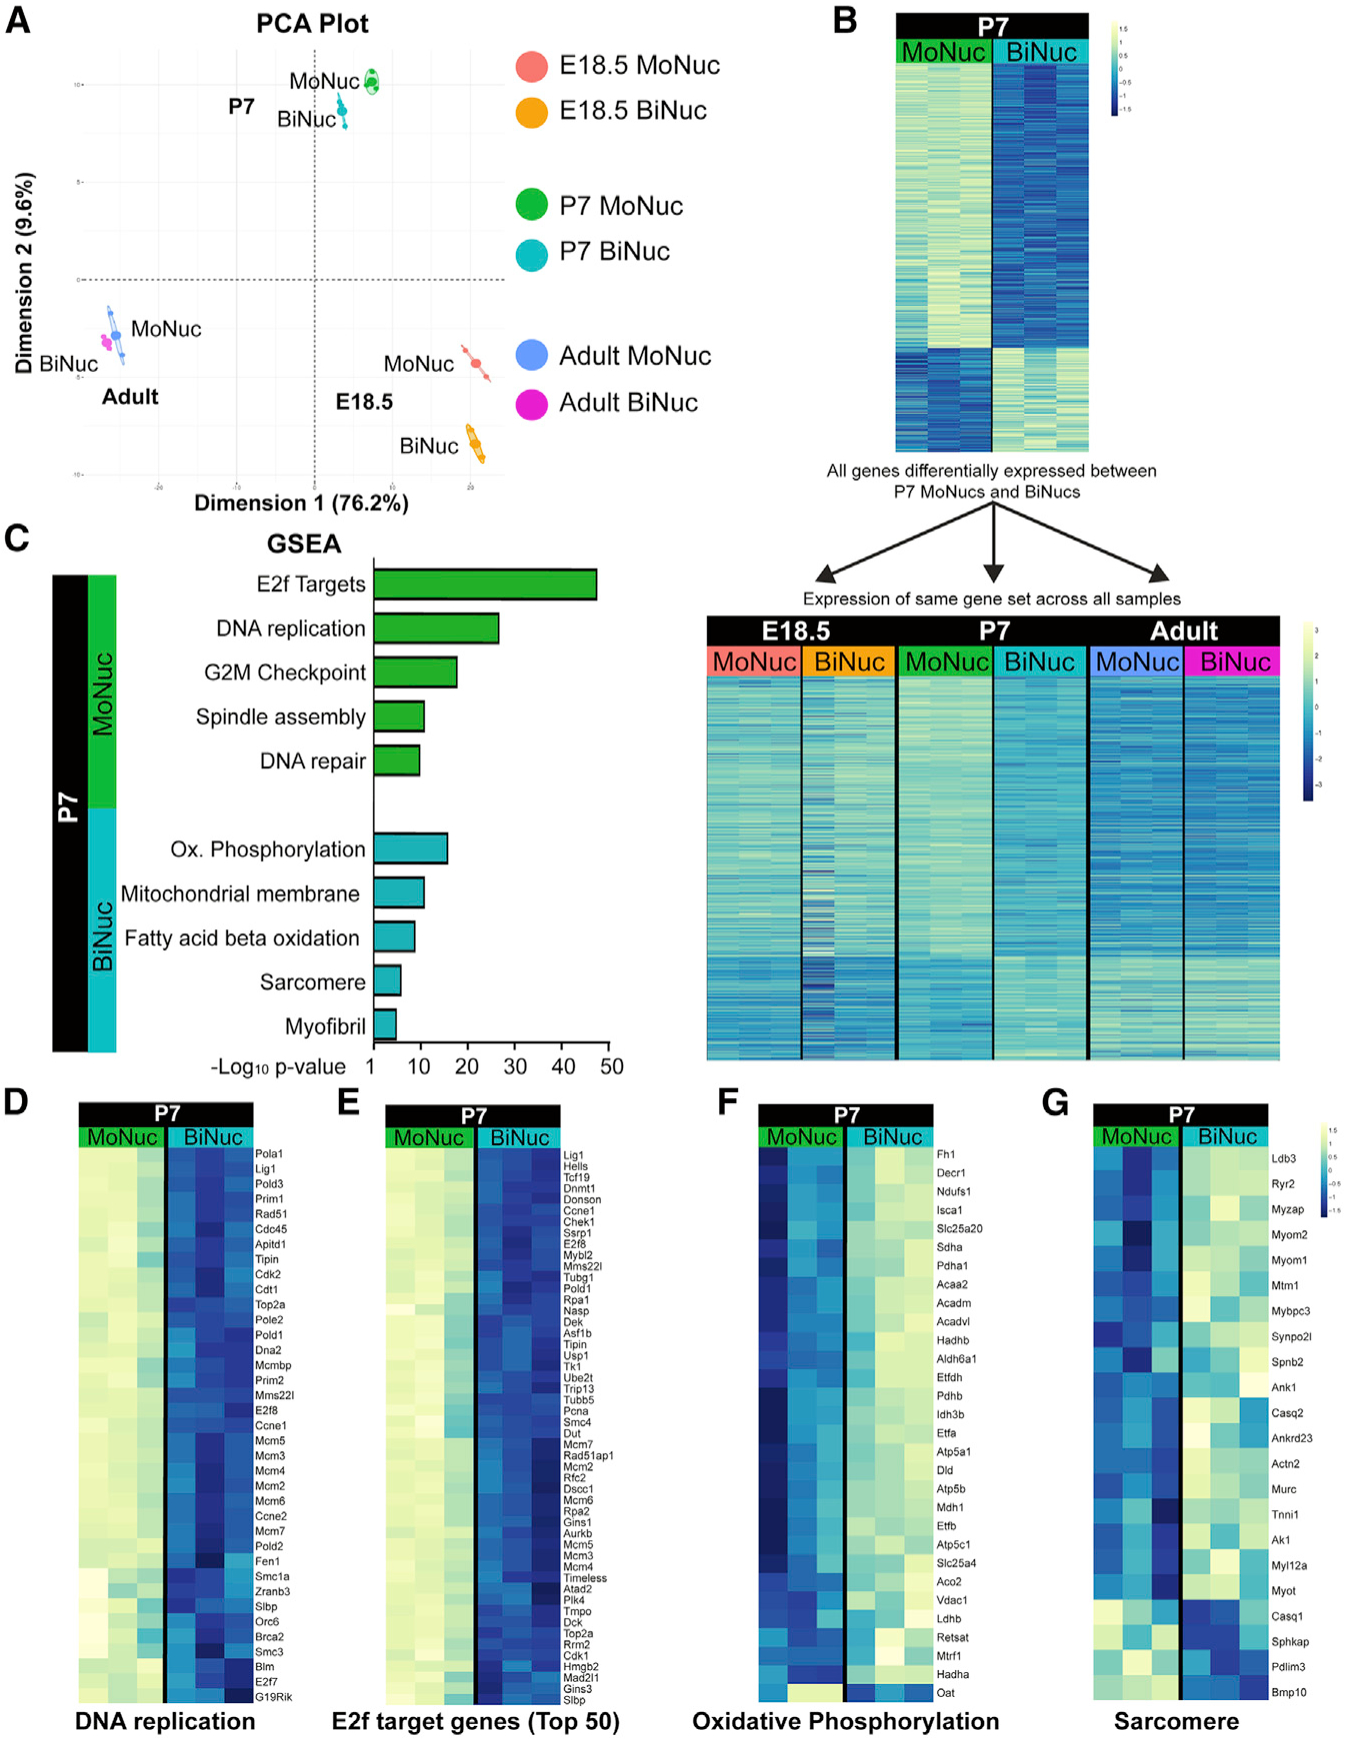
Figure 2. Binucleation Is Accompanied by a Switch from a Proliferation-Associated Gene Expression Program to One Associated with Maturation.

(A) Principal component analysis (PCA) from RNA-seq of MoNucs and BiNucs from E18.5, P7, and adult hearts shows that at each time point, MoNucs and BiNucs are transcriptionally distinct. n = 3 animals per time point.
(B) Heatmaps of genes with significant differences (FDR < 0.05) in expression between P7 MoNucs and BiNucs. Gene expression values are represented at P7 only (top) and at all time points (bottom). Bottom heatmap reveals that the gene expression profile of P7 BiNucs but not P7 MoNucs bears a resemblance to the profiles of adult samples. The difference in intensity between top and bottom heatmaps is due to the different scales used.
(C) Representative categories from gene set enrichment analysis (GSEA) of differential gene expression between P7 MoNucs and BiNucs. P7 MoNucs are enriched for genes involved in the cell cycle, while P7 BiNucs are enriched for genes involved in cardiomyocyte maturation. Analysis was done using Camera.
(D–G) Heatmaps comparing expression between P7 MoNucs and BiNucs of gene sets included in (C). E2f target gene heatmap shows top 50 differentially expressed genes from the set of 199 genes.
See also Figure S2.
