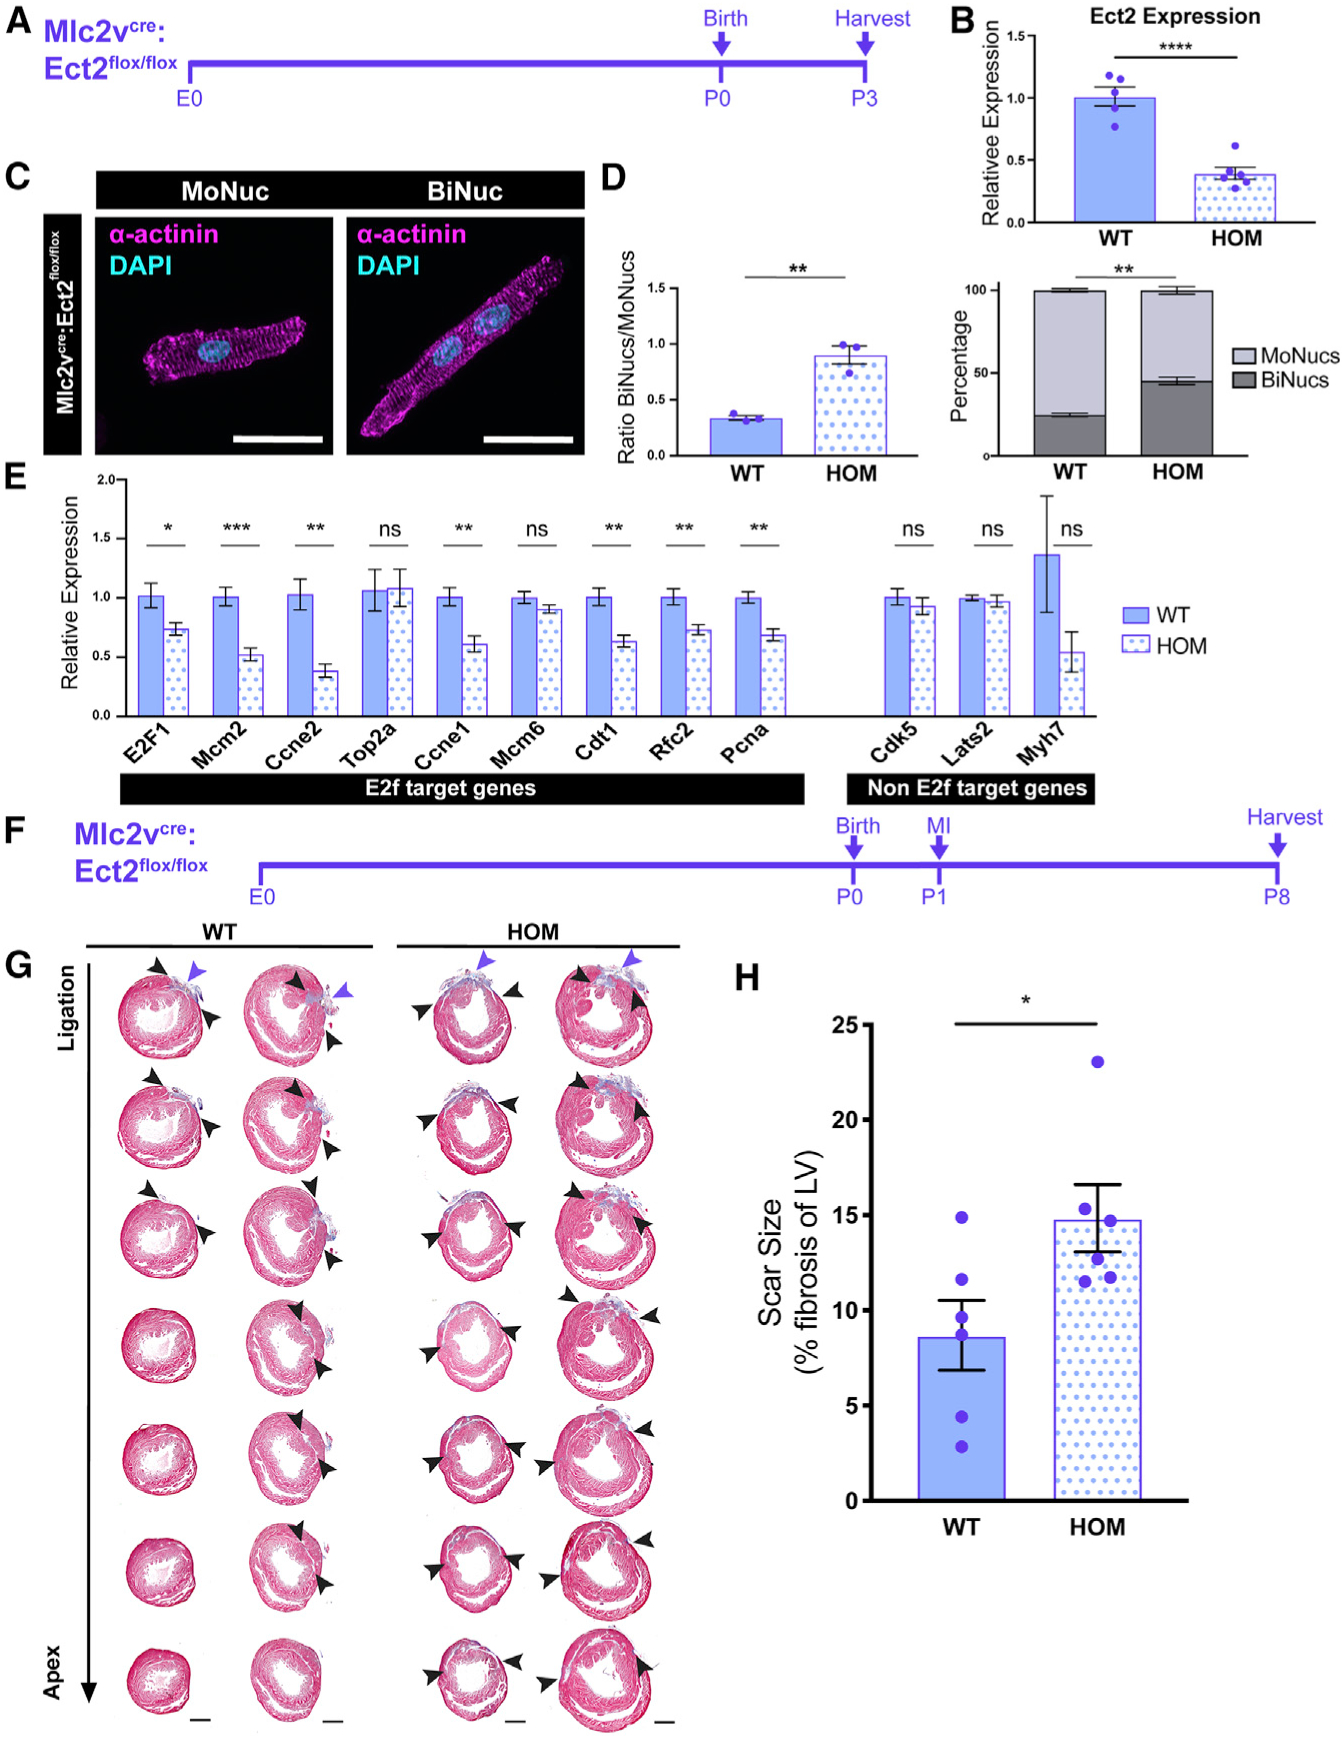
Figure 7. Binucleation Results in Downregulation of E2f Target Genes and Impairment of Regenerative Potential.

(A) Time course of Mlc2vcre:Ect2flox/flox KO.
(B) Expression values of the Ect2 transcript in Mlc2vcre:Ect2flox/flox (HOM) samples compared to Ect2flox/flox and Ect2flox/+ (WT) samples at P3 by qPCR. Data are reported as mean ± SEM. n = 5–6 animals per group.
(C) Images of P3 HOM MoNuc and BiNuc CMs from fixed single-cell suspensions stained with anti-α-actinin. Scale bar, 20 μm.
(D) Quantification of the ratio of BiNucs to MoNucs and percentages of MoNucs and BiNucs in P3 WT and HOM samples. Data are reported as mean ± SEM. n = 3 animals per group.
(E) Gene expression differences between WT and HOM samples of E2f target genes and non-E2f target genes. Data are reported as mean ± SEM. n = 5–6 animals per group. p values are determined by Student’s t test. ns, not significant.
(F) Schematic showing study design of myocardial infarction (MI) by ligation of the left anterior descending (LAD) artery in Mlc2vcre:Ect2flox/flox mutant and control mice at P1.
(G) Masson’s trichrome-stained heart sections from the ligation site toward the apex 7 days after injury. n = 6 per group.
(H) Quantification of the percentage of left ventricular myocardium containing scar tissue at P8. Suture location is indicated with the purple arrow. Scar boundaries are indicated with black arrows. Scale bar, 500 μm. Data are reported as mean ± SEM. n = 6 animals per group. p values are determined by Mann-Whitney U test. ns, not significant, *p < 0.05, **p < 0.01, ***p < 0.001, ****p < 0.0001.
