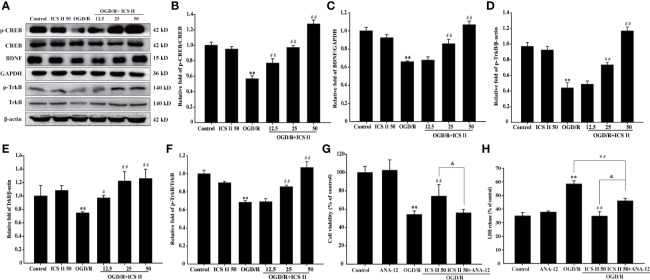
Figure 3.
ICS II up-regulated the expressions of BDNF, p-TrkB, TrkB, and p-CREB after OGD/R insult. (A) Representative Western blot images of BDNF, p-TrkB, and TrkB. (B) Quantitation of BDNF. (C) Quantitation of p-TrkB. (D) Quantitation of TrkB. (E) Representative Western blot images of p-CREB and CREB. (F) Quantitation of p-CREB/CREB. TrkB-specific inhibitor ANA-12 abolished the beneficial effects of ICS II. (G) Cell viability tested by MTT assay. (H) LDH release was detected using an LDH release assay kit. Data are presented as means ± SD (n = 3). **P < 0.01 versus control group; #P < 0.05, ##P < 0.01 versus OGD/R group, &P < 0.01 versus OGD/R+ ICS II 50 group.

