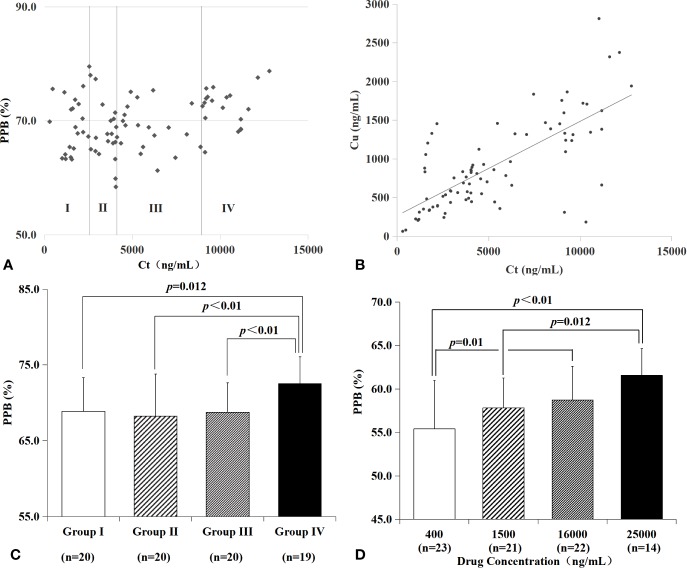
Figure 2.
PPB and Cu characteristics of VRC in plasma from patients and blank plasma spiked with drugs in different Ct. There was a trend of positive relationship between Ct and PPB (A, R=0.291), Ct and Cu (B, R=0.724) in plasma from patients. Patients with a higher Ct in group IV had a significantly higher PPB (C, group I vs. group IV, p=0.012; group II vs. group IV, p < 0.01; group III vs. group IV, p<0.01). Blank plasmas spiked with VRC in vitro were divided into four groups according to drug concentration (D). There was a significant lower PPB of 400 ng/ml VRC than 16,000 ng/ml VRC (p=0.01), or 25,000 ng/ml VRC (p<0.01); 1,500 ng/ml VRC had a significantly lower PPB than 25,000 ng/ml (p=0.012).

