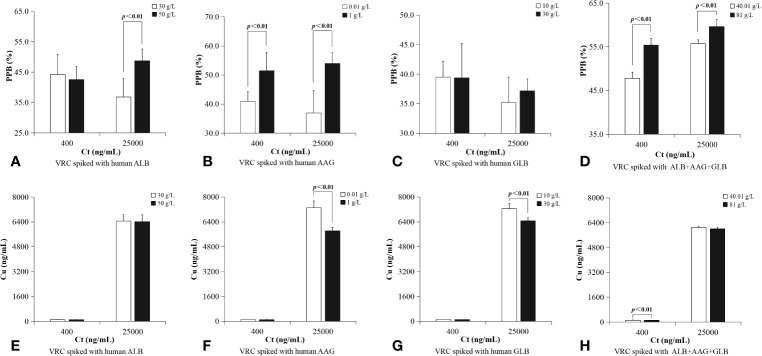
Figure 4.
PPBs of plasma protein solutions spiked with VRC in vitro were grouped according to protein concentration. ALB binding rate of samples in higher Ct group (25,000 ng/ml) with higher protein concentration was significantly higher (A, 50 vs. 30 g/L, p < 0.01). AAG binding rate of samples with higher protein concentration had a significant higher PPB in both two Ct groups (B, Ct=400 ng/ml, [0.01 vs. 1 g/L, p = 0.001]; Ct=25,000 ng/ml, [0.01 vs. 1 g/L, p < 0.01]); GLB binding rate was without this characteristic in either lower Ct group or higher Ct group (C). Plasma protein mixtures spiked with a higher concentration of protein (Cp=81 g/L) had a significant higher PPB than the lower group (Cp=40.01 g/L) in both two different Ct groups (D, Ct=400 ng/ml, [40.01 vs. 81 g/L, p < 0.01]; Ct=25,000 ng/ml, [40.01 vs. 81 g/L, p < 0.01]). There was no significant difference between lower ALB concentration and higher ALB concentration in either lower Ct group or higher Ct group (E). In a higher Ct (25,000 ng/ml), Cu of a lower AAG concentration was significantly higher than samples with higher AAG concentration (F, 0.01 vs. 1 g/L, p < 0.01). In a higher Ct (25,000 ng/ml), Cu of in vitro samples with a lower GLB concentration (10 g/L) was significantly higher than samples with higher GLB concentration (G, 30 g/L, p < 0.01). In a lower Ct (400 ng/ml), Cu of a lower plasma protein concentration was significantly higher than sample with a higher plasma protein concentration (H, 40.01 vs. 81 g/L, p < 0.01).

