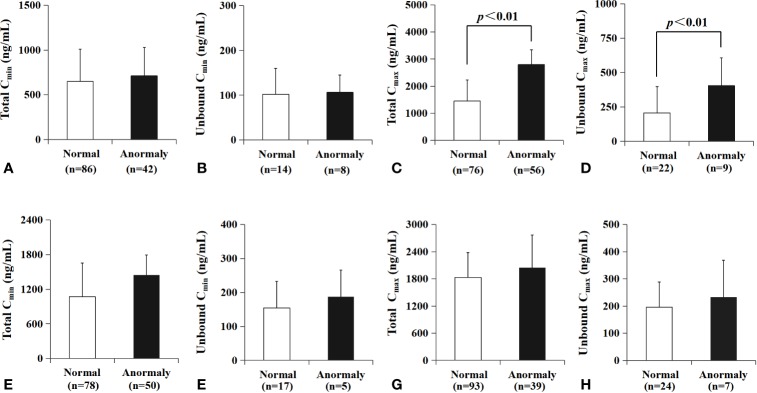
Figure 7.
Relationship between AST or ALT level and drug concentration, respectively. There was no significant difference between patients with AST in normal value and those with abnormal AST (shown in A, B) in Cmin. The total Cmax of VRC in patients with AST in normal value were significantly lower than those with abnormal AST value (p<0.01, C). The unbound Cmax of VRC in patients with normal AST was lower than those with abnormal AST value (p<0.01, D). ALT values showed no significant influence on either Ct or Cu in minimum or maximum concentration (E–H).

