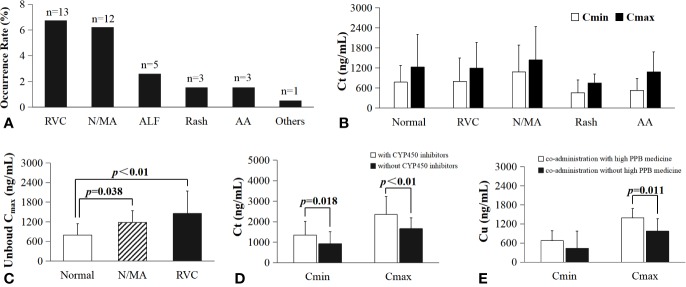
Figure 8.
The impact of co-administration and the relationship of VRC drug concentration with ADRs. RVC, reversible visual changes; N/MA, nerval or mental abnormity; ALF, abnormal liver function; AA, abnormal audition; (A), the occurrence rate and frequency of all ADRs; (B), Ct (including Cmax and Cmin) in patients with and without (normal group) ADRs; (C), significant difference in patients unbound Cmax with and without ADRs; the unbound Cmax in patients without ADRs (792.8 ± 348.9 ng/ml, n=21) was significantly lower than those with nerval or mental abnormity (1187 ± 355 ng/ml, n=10, p=0.038), with reversible visual changes (1453 ± 693 ng/ml, n=13, p<0.01).; (D), The Ct in patient co-administration with CYP450 inhibitor esomeprazole (Cmin=1355 ± 657 ng/ml, n=24; Cmax=2354 ± 867 ng/ml, n=33) was significantly higher than those without CYP450 inhibitor (Cmin=0.930 ± 0.581, n=318, p=0.018; Cmax=1.657 ± 0.530, n=429, p<0.01); (E), significant difference of unbound Cmax in plasma samples from patients co-administration with (1390 ± 541 ng/ml, n=28) or without high PPB medicine (971.1 ± 390.8 ng/ml, n=16, p=0.011).

