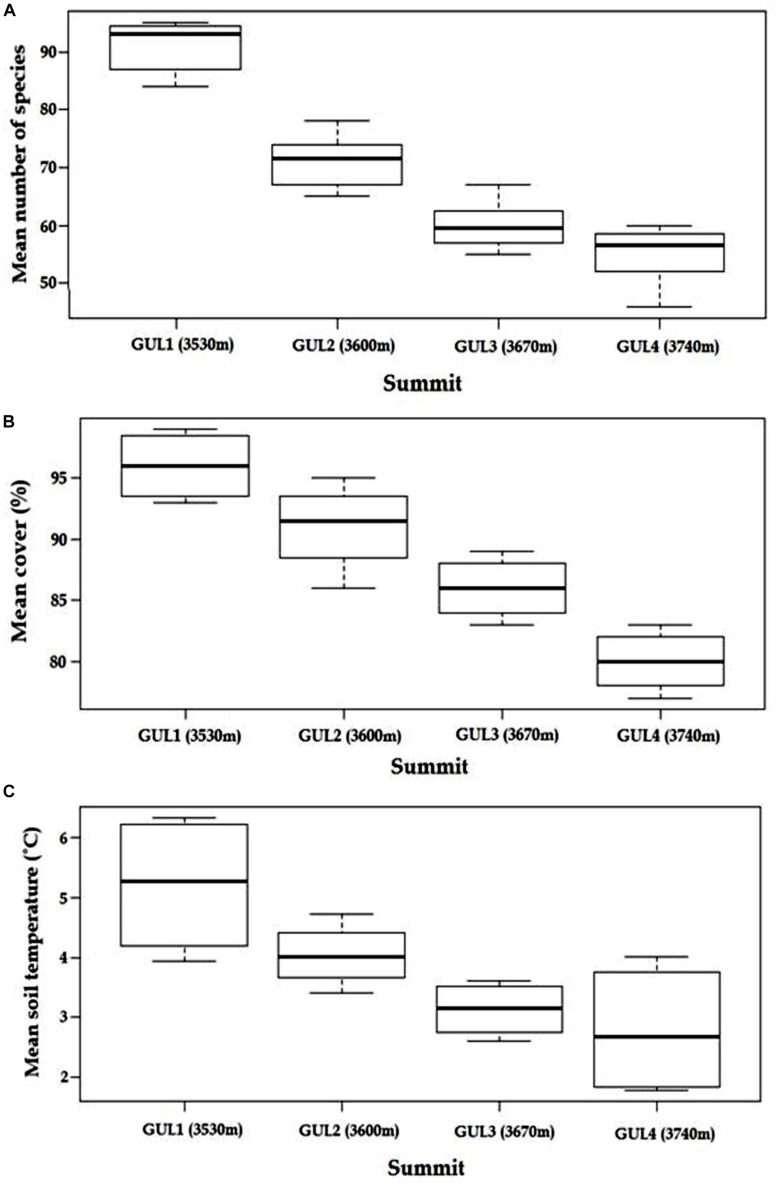
FIGURE 2.
Patterns of (A) mean species richness, (B) mean cover percentage and (C) mean soil temperature with successively increasing elevation of summits in 2014. Results are depicted as mean ± standard error of mean. Whiskers in the box plot indicate the 25 and 75% percentiles. The line within each boxplot represents the mean value for that plot.

