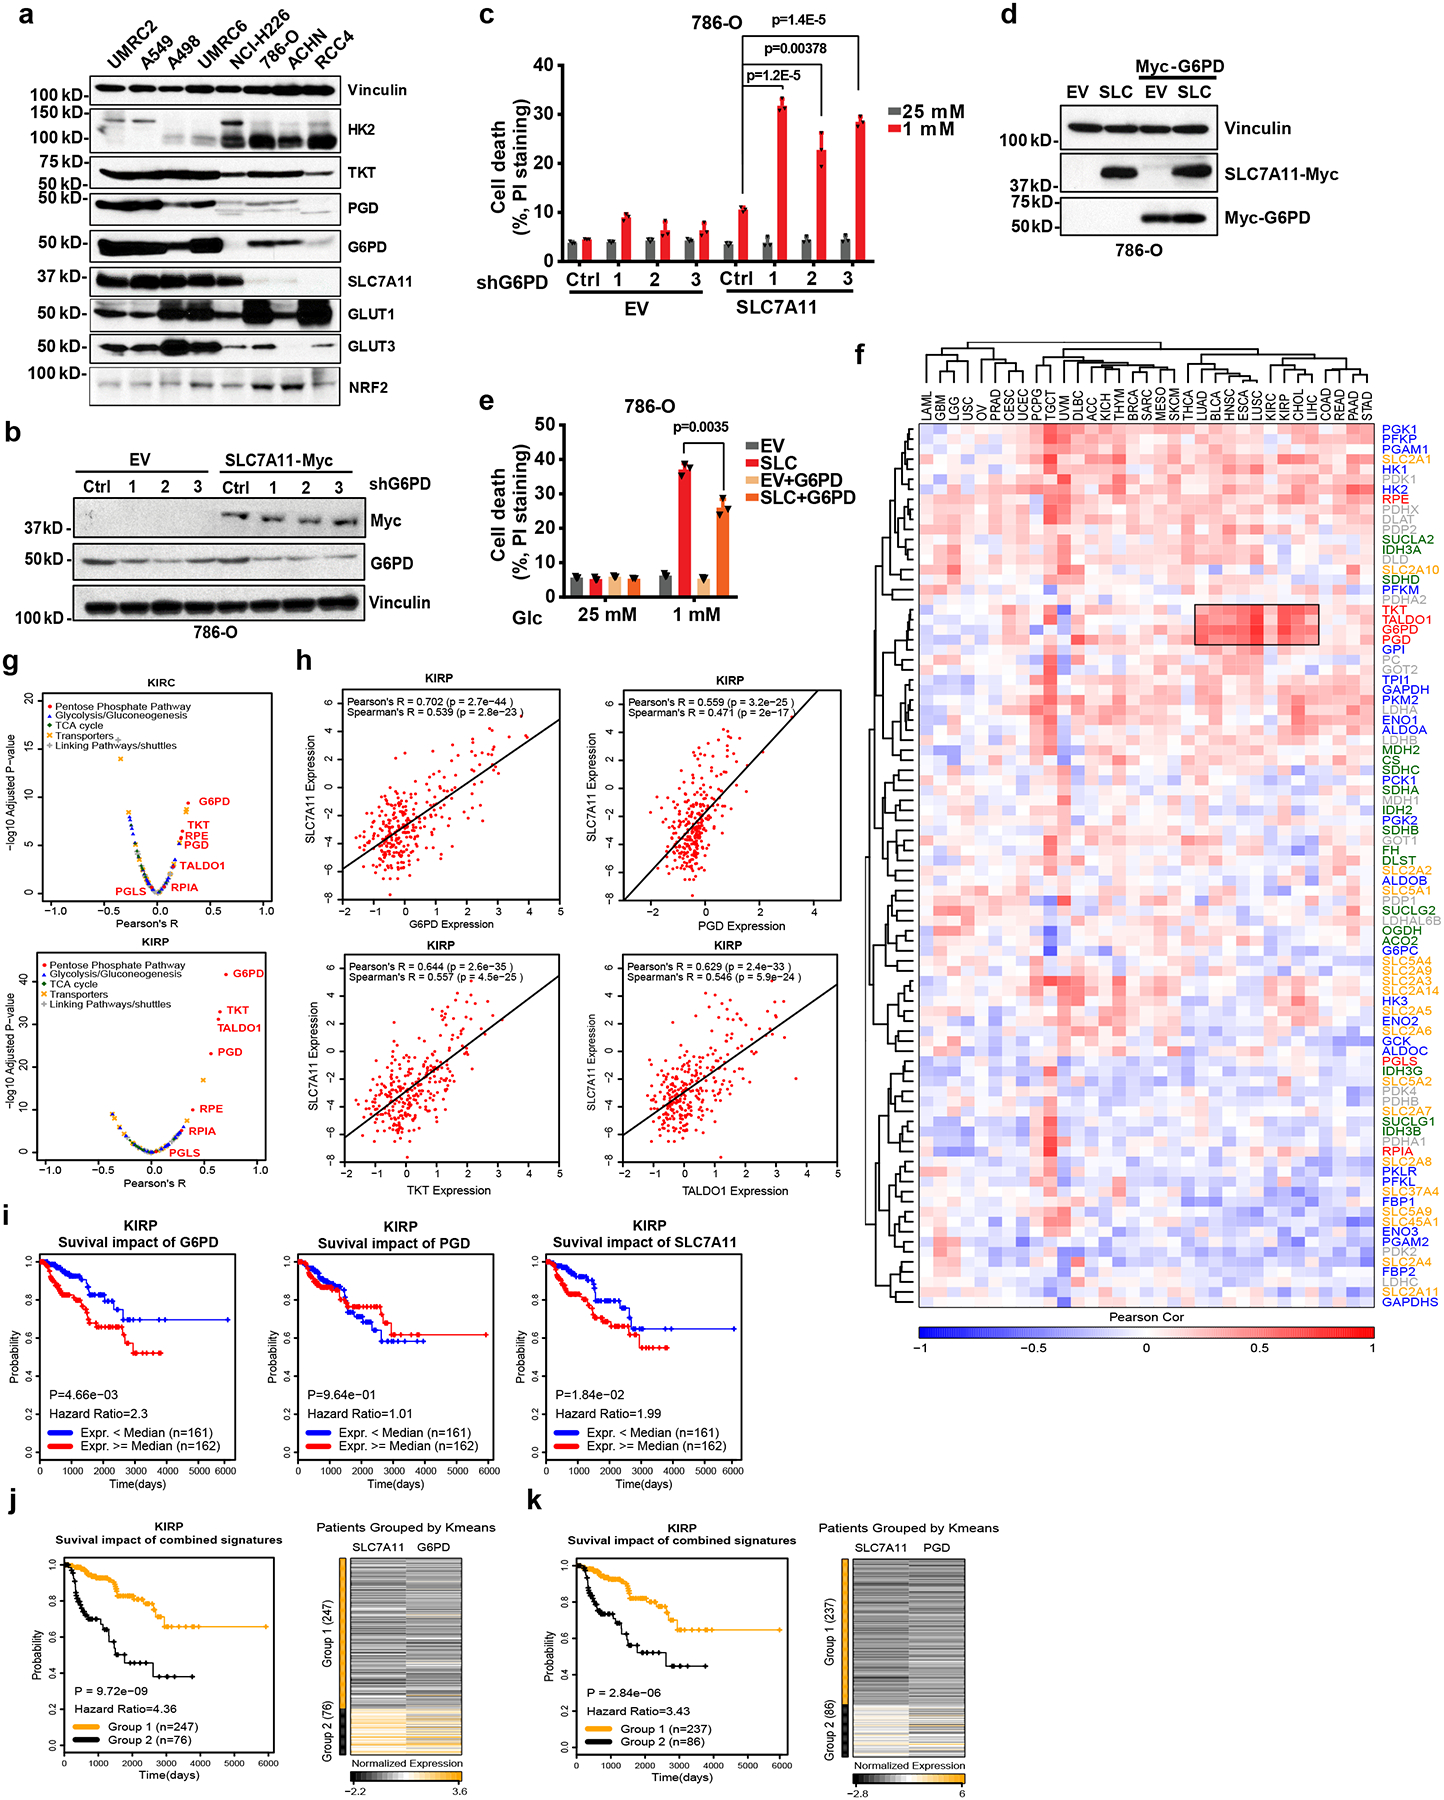
Fig. 2. The cross-talk between SLC7A11 and the PPP in regulating glucose-limitation-induced cell death and their co-expression in human cancers.

a, The protein levels of SLC7A11 and other indicated genes involved in glucose metabolism in different cancer cell lines were determined by Western blotting. Vinculin is used as a loading control. b, c, Protein levels and cell death in response to glucose limitation in EV and SLC7A11-overexpressing 786-O cells with or without G6PD knockdown were measured by Western blotting (b) and PI staining (c). d, e, protein levels and cell death in response to glucose limitation in EV and SLC7A11-overexpressing 786-O cells with or without G6PD overexpression were measured by Western blotting (d) and PI staining (e). In c and e, error bars are mean ± s.d., n=3 independent experiments, p values were calculated using two-tailed unpaired Student’s t-test. f, The Pearson’s correlation between expression of SLC7A11 and glucose metabolism genes in 33 cancer types from TCGA. The cancer types (columns) and genes (rows) are ordered by hierarchical clustering. PPP genes are highlighted in red at right side. The independent samples’ numbers of cancer types are described in the Methods. g, Compared to other glucose metabolism genes, PPP genes show significant positive correlations with SLC7A11 in KIRP (n=290) and KIRC (n=533). h, Scatter plots showing the correlation between SLC7A11 and 4 PPP genes (G6PD, PGD, TKT, TALDO1) in KIRP (n=290). i, Kaplan–Meier plots of KIRP patients stratified by SLC7A11, G6PD, and PGD expression levels, respectively. j, Kaplan–Meier plots of KIRP patients stratified by unsupervised clustering on SLC7A11 and G6PD expression. Group 1 has lower SLC7A11 and G6PD expression, while Group 2 has higher SLC7A11 and G6PD expression. k, Kaplan–Meier plots of KIRP patients stratified by unsupervised clustering on SLC7A11 and PGD expression. Group 1 has lower SLC7A11 and PGD expression, while Group 2 has higher SLC7A11 and PGD expression. The experiments (a, b, d) were repeated three times, independently, with similar results. Detailed statistical tests of f-k are described in the Methods. Numeral data are provided in Statistics Source Data Fig. 2. Scanned images of unprocessed blots are shown in Source Data Fig.2.
