
Extended Data Fig. 1. The effect of SLC7A11 overexpression on glutamate, TCA cycle and glycolysis metabolites, and the expression levels of PPP enzymes.
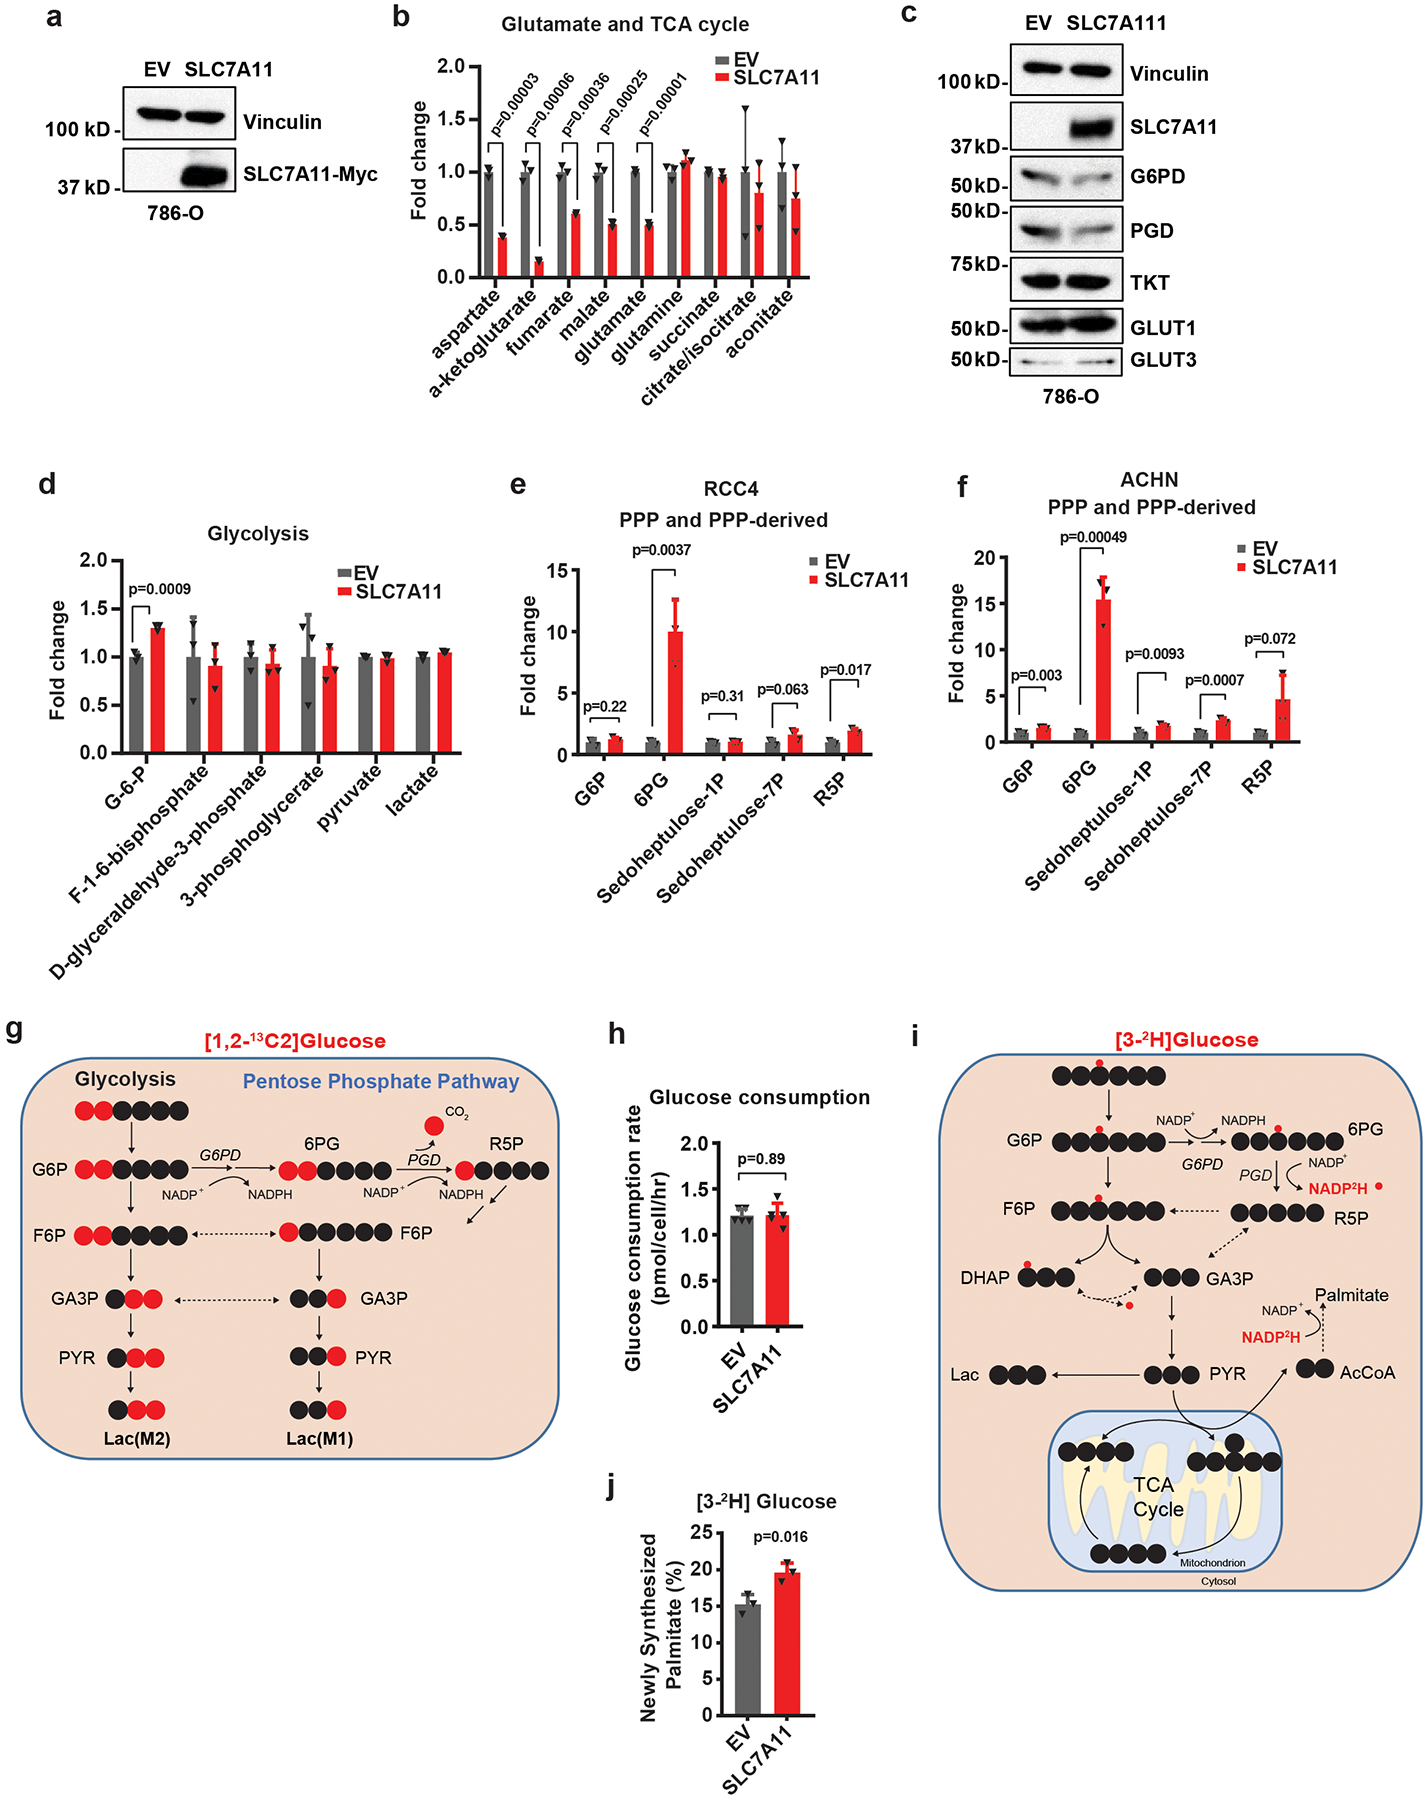
a, Western blotting showing Myc-tagged SLC7A11 expression in 786-O cells. The experiment was repeated five times, independently, with similar results. b, Bar graph showing relative fold changes of glutamate and TCA cycle metabolites in EV and SLC7A11-overexpressing 786-O cells. n=3 independent experiments. c, Western blotting showing indicated protein levels in EV and SLC7A11-overexpressing 786-O cells. The experiment was repeated twice, independently, with similar results. d, Bar graph showing relative fold changes of glycolysis metabolites in EV and SLC7A11-overexpressing 786-O cells. n=3 independent experiments. e,f, Bar graph showing the fold changes of PPP and PPP-derived intermediates induced by SLC7A11 overexpression in RCC4 or ACHN cells. n=3 independent experiments. g, Simplified schematic of glycolysis and the PPP, showing 13C labeling patterns resulting from 1,2-13C2 glucose. Red fills indicate 13C atoms. h, Glucose consumption rates in EV and SLC7A11-overexpressing 786-O cells. n=5 independent experiments. i, Simplified schematic showing the sequential transfer of deuterium labels at position 3 of glucose to NADPH and then newly synthesized palmitic acid. Red circles indicate positional deuterium labels. j, Newly synthesized deuterium labelled palmitate in EV and SLC7A11-overexpressing 786-O cells. n=3 independent experiments. In (j), data are plotted as mean ±95% confidence interval (CI). Other error bars are mean ± s.d.. All p values were calculated using two-tailed unpaired Student’s t-test. Detailed statistical tests are described in the Methods. Scanned images of unprocessed blots are shown in Source Data Extended Data Fig. 1. Numeral data are provided in Statistics Source Data Extended Data Fig. 1.